---
title: "Debug Node.js app running in a Docker container"
description:
"By using the Docker VSCode extension and VSCode-debug launch configuration,
debugging the node.js app in docker can be achieved."
canonical_url: "https://www.bigbinary.com/blog/debug-nodejs-app-running-in-a-docker-container"
markdown_url: "https://www.bigbinary.com/blog/debug-nodejs-app-running-in-a-docker-container.md"
---
# Debug Node.js app running in a Docker container
By using the Docker VSCode extension and VSCode-debug launch configuration,
debugging the node.js app in docker can be achieved.
- Author: Preveen Raj
- Published: May 25, 2021
- Categories: JavaScript
A Docker container is a standard unit of software that packages up code and all
its dependencies so the application runs quickly and reliably from one computing
environment to another. One who have dealt with it would have wanted to debug
their application like they do it normally, but it often feels difficult to
configure. Let's do it in a simple way.
### 1. Install [Docker Extension](https://marketplace.visualstudio.com/items?itemName=ms-azuretools.vscode-docker) for VSCode
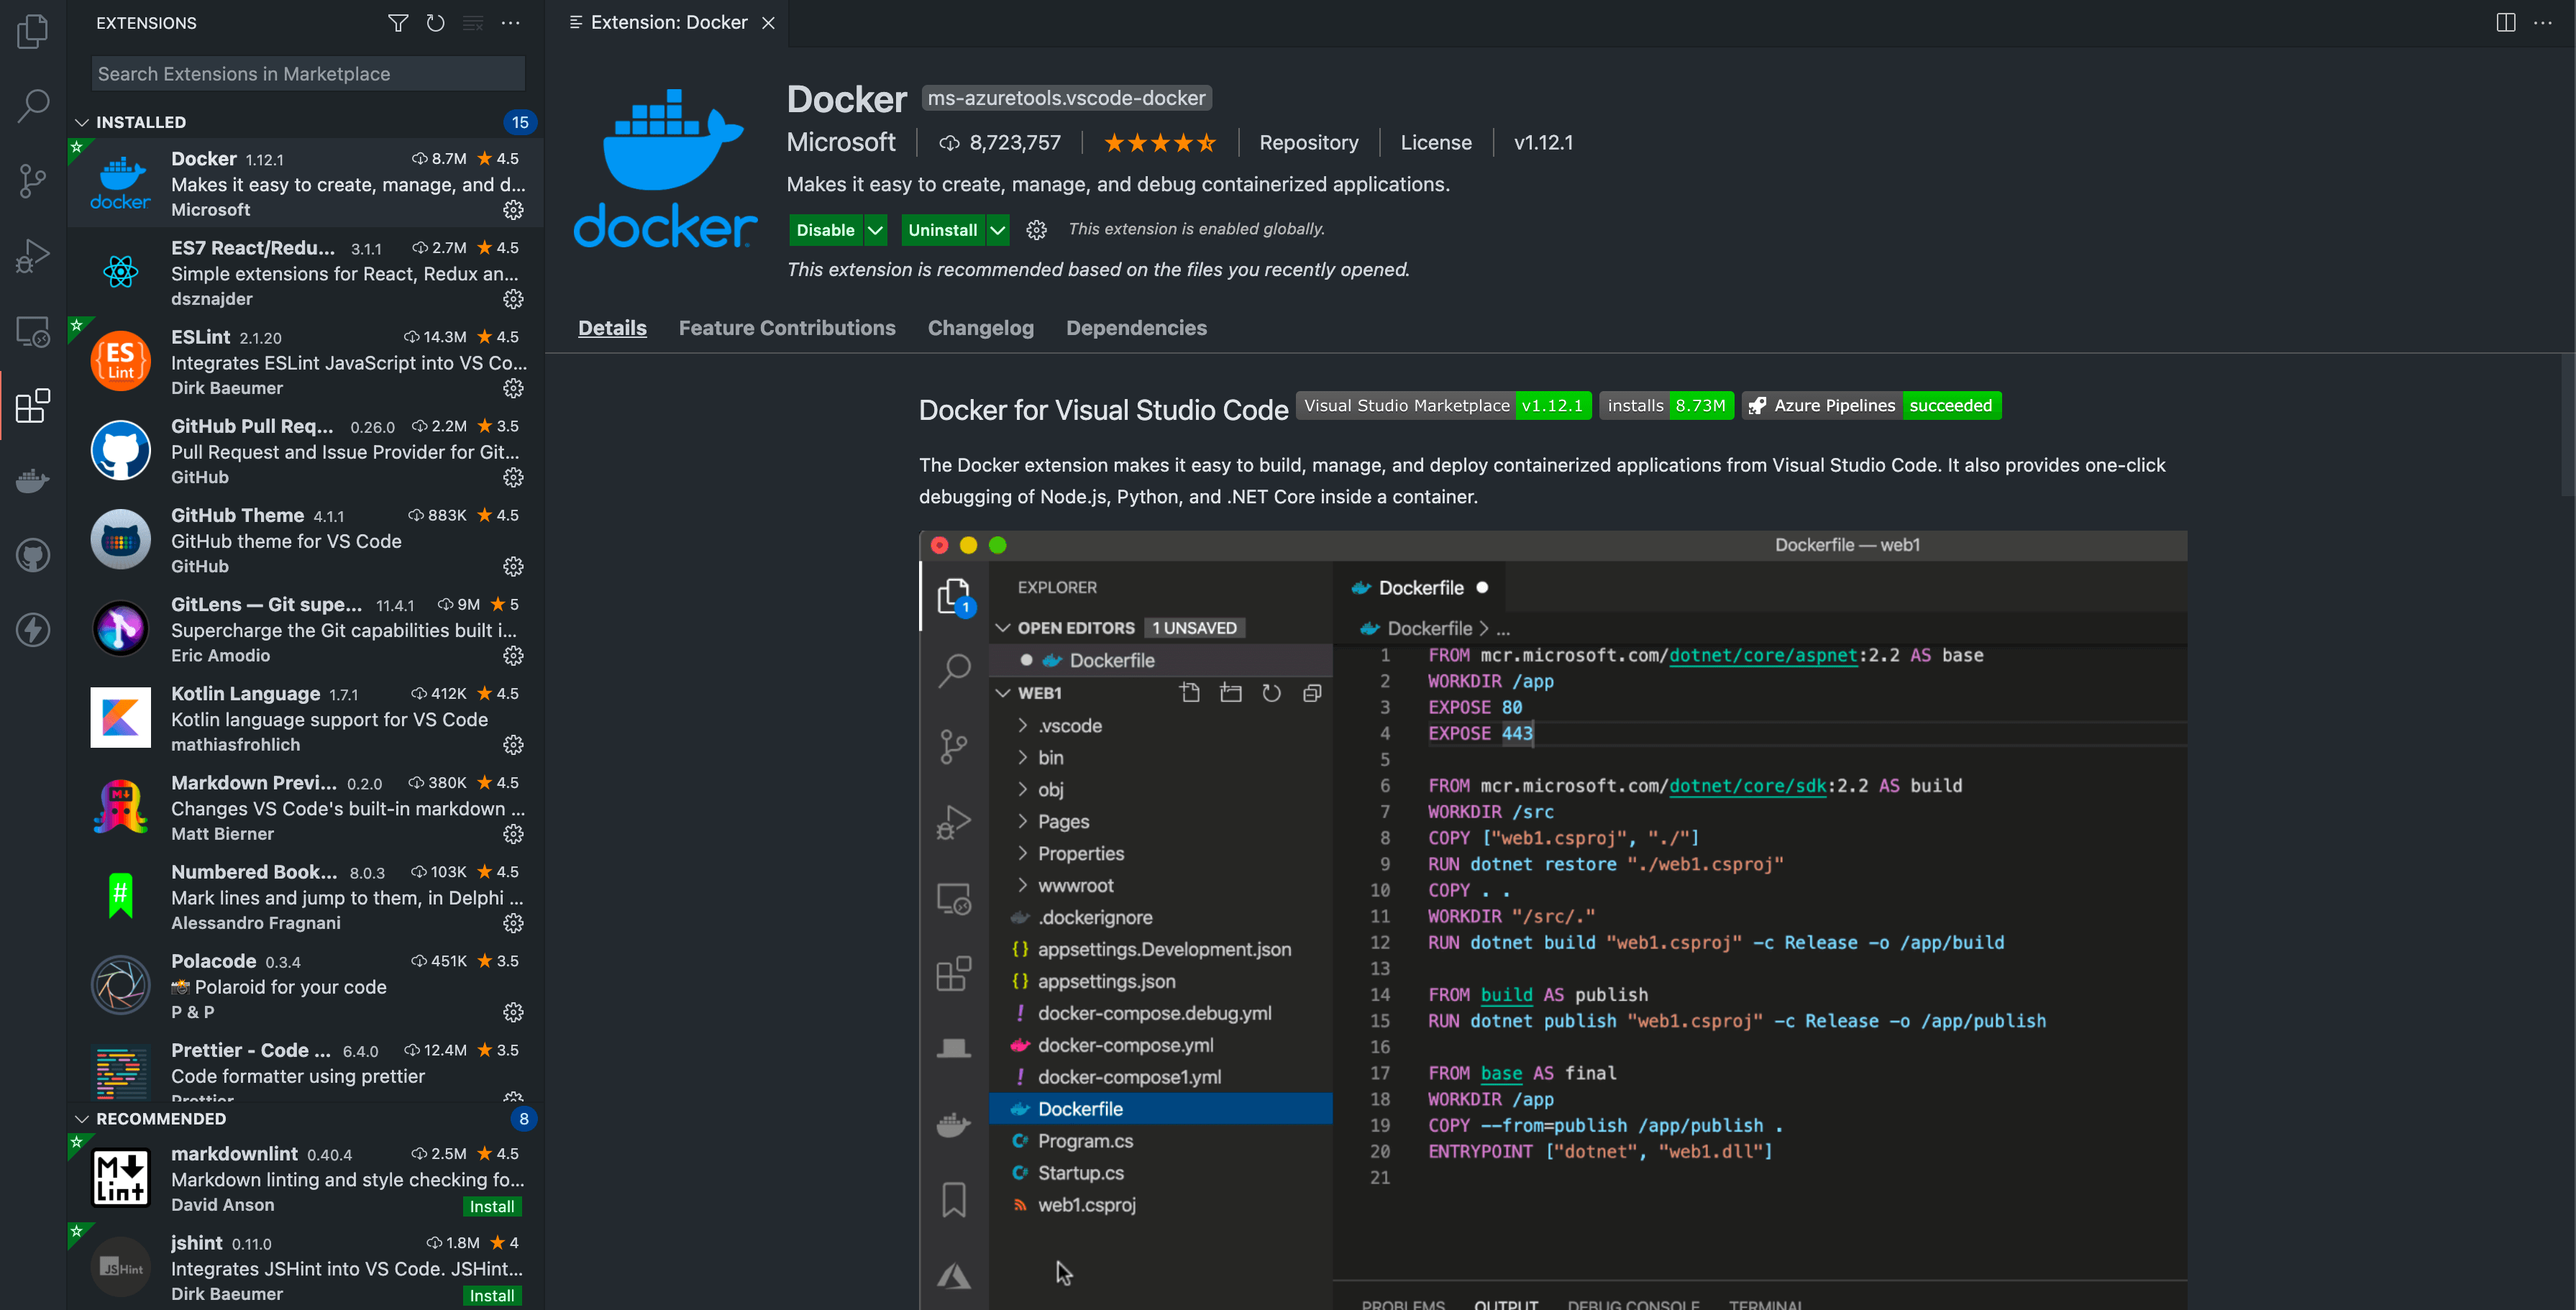 This extension will be responsible for VSCode to debug an app inside the Docker
container. It will also enable us to manage Docker images and containers.
### 2. Expose port 9229 in the docker-compose.yml
Port `9229` is the default node.js debugging port.
This will bind the port of the container with that of the host machine enabling
the VSCode debugger to attach to the port.
```yml
version: "3.9"
services:
backend:
container_name: nodejs
restart: always
build:
context: .
ports:
- "80:3000"
- "5678:5678"
- "9229:9229"
command: yarn dev
```
##### OR
> If you are directly running the app from command line, then you can append:
> `-p 9229:9229` to the docker-run command. Example:
```bash
docker run -d -p 80:3000 -p 9229:9229 node:15.0.1-alpine
```
### 3. Add the inspect switch to the npm script
```bash
nodemon --inspect=0.0.0.0:9229 --watch server server/bin/www
```
Make sure you add the address and port to the inspect switch. When started with
the --inspect switch, a node.js process listens for a debugging client. By
default, it will listen to the host and port `127.0.0.1:9229`. For Docker, we
would have to update it to `0.0.0.0:9229`.
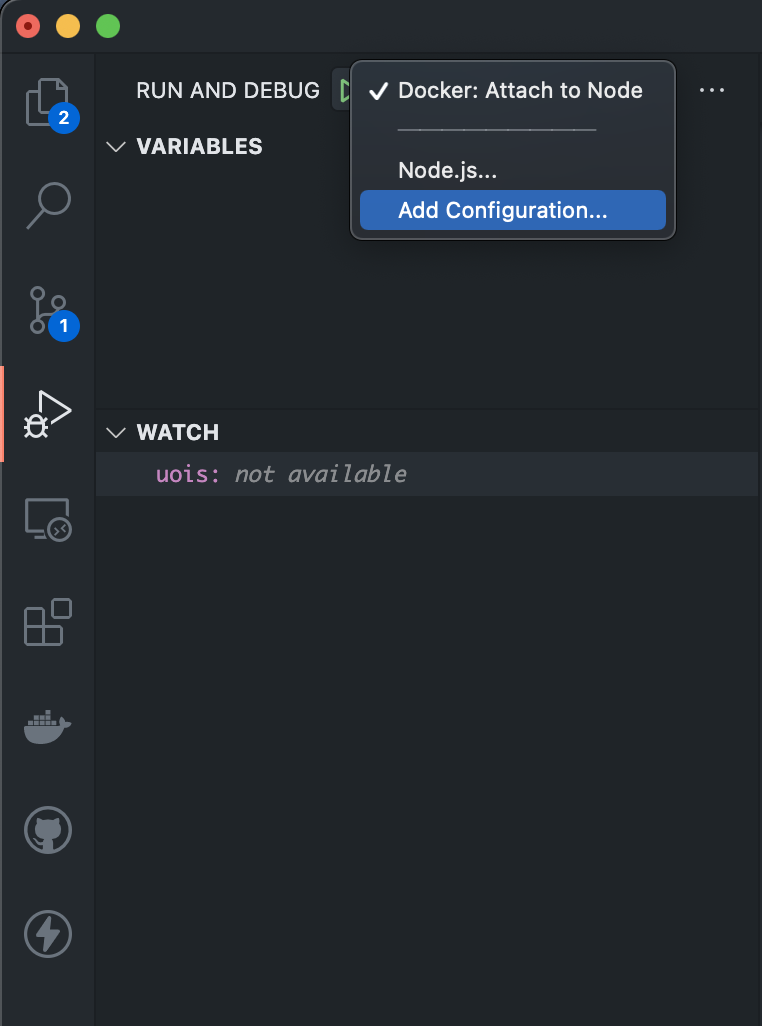
### 4. Create a VSCode launch.json
You can generate a `launch.json` from the Debug tab of VSCode. Click on the drop
down and select **Add Configuration**.
This extension will be responsible for VSCode to debug an app inside the Docker
container. It will also enable us to manage Docker images and containers.
### 2. Expose port 9229 in the docker-compose.yml
Port `9229` is the default node.js debugging port.
This will bind the port of the container with that of the host machine enabling
the VSCode debugger to attach to the port.
```yml
version: "3.9"
services:
backend:
container_name: nodejs
restart: always
build:
context: .
ports:
- "80:3000"
- "5678:5678"
- "9229:9229"
command: yarn dev
```
##### OR
> If you are directly running the app from command line, then you can append:
> `-p 9229:9229` to the docker-run command. Example:
```bash
docker run -d -p 80:3000 -p 9229:9229 node:15.0.1-alpine
```
### 3. Add the inspect switch to the npm script
```bash
nodemon --inspect=0.0.0.0:9229 --watch server server/bin/www
```
Make sure you add the address and port to the inspect switch. When started with
the --inspect switch, a node.js process listens for a debugging client. By
default, it will listen to the host and port `127.0.0.1:9229`. For Docker, we
would have to update it to `0.0.0.0:9229`.
### 4. Create a VSCode launch.json
You can generate a `launch.json` from the Debug tab of VSCode. Click on the drop
down and select **Add Configuration**.
 This action would generate a default JSON configuration. Replace the content
with the below:
```JSON
{
"version": "0.2.0",
"configurations": [
{
"name": "Docker: Attach to Node",
"type": "node",
"request": "attach",
"restart": true,
"port": 9229,
"address": "localhost",
"localRoot": "${workspaceFolder}",
"remoteRoot": "/usr/src/app",
"protocol": "inspector"
}
]
}
```
### 5. Start the docker container and attach the debugger.
After your Docker container has been successfully launched, you can attach the
debugger to it at any time by clicking the play button in the same Debug tab
where we built the `launch.json` configuration.
VSCode will now adjust the color of its bottom status bar to indicate that it is
in debugging mode, and you are ready to go.
You can put breakpoints anywhere in your file and get your work done faster and
better than before.
#### Bonus Tip
> Since the debugger has full access to the Node.js execution environment, a
> malicious agent who can bind to this port will be able to execute arbitrary
> code on the Node.js process's behalf. It is important to understand the
> security implications of exposing the debugger port on public and private
> networks. Make sure you are not exposing the debugging port in production
> environment.
## Links
- [Human page](https://www.bigbinary.com/blog/debug-nodejs-app-running-in-a-docker-container)
This action would generate a default JSON configuration. Replace the content
with the below:
```JSON
{
"version": "0.2.0",
"configurations": [
{
"name": "Docker: Attach to Node",
"type": "node",
"request": "attach",
"restart": true,
"port": 9229,
"address": "localhost",
"localRoot": "${workspaceFolder}",
"remoteRoot": "/usr/src/app",
"protocol": "inspector"
}
]
}
```
### 5. Start the docker container and attach the debugger.
After your Docker container has been successfully launched, you can attach the
debugger to it at any time by clicking the play button in the same Debug tab
where we built the `launch.json` configuration.
VSCode will now adjust the color of its bottom status bar to indicate that it is
in debugging mode, and you are ready to go.
You can put breakpoints anywhere in your file and get your work done faster and
better than before.
#### Bonus Tip
> Since the debugger has full access to the Node.js execution environment, a
> malicious agent who can bind to this port will be able to execute arbitrary
> code on the Node.js process's behalf. It is important to understand the
> security implications of exposing the debugger port on public and private
> networks. Make sure you are not exposing the debugging port in production
> environment.
## Links
- [Human page](https://www.bigbinary.com/blog/debug-nodejs-app-running-in-a-docker-container)