Setting up Prometheus and Grafana on Kubernetes using Helm
January 25, 2024
In this blog, we will learn how to set up Prometheus and Grafana on Kubernetes using Helm.
Prometheus along with Grafana is a highly scalable open-source monitoring framework for container orchestration platform. Prometheus probes the application and collects various data. It stores all this data in its time series database. Grafana is a visualization tool. It uses the data from the database to show the data that is meaningful to the user.
Both Prometheus and Grafana are gaining popularity in the observability space as it helps with metrics and alerts. Learning to integrate them using Helm will allow us to monitor our Kubernetes cluster and troubleshoot problems easily. Furthermore, we can deep dive into our cluster's well-being and efficiency, focusing on resource usage and performance metrics within our Kubernetes environment.
We will also learn how to create a simple dashboard on Grafana.
Why using Prometheus and Grafana for monitoring is good
Using Prometheus and Grafana for monitoring has many benefits:
- Scalability: Both tools are highly scalable and can handle the monitoring needs of small to large Kubernetes clusters.
- Flexibility: They allow us to create custom dashboards tailored to our specific monitoring requirements.
- Real-time Monitoring: Prometheus provides real-time monitoring, helping us to quickly detect and respond to issues.
- Alerting: Prometheus enables us to set up alerts based on specific metrics, so we can be notified when issues arise.
- Data Visualization: Grafana offers powerful data visualization capabilities, making it easier to understand complex data.
- Open Source: Both Prometheus and Grafana are open-source, reducing monitoring costs.
- Community Support: We can benefit from active communities, ensuring continuous development and support.
- Integration: They seamlessly integrate with other Kubernetes components and applications, simplifying setup.
- Historical Data: Grafana allows us to explore historical data, aiding in long-term analysis and trend identification.
- Extensible: Both tools are extensible, allowing us to integrate additional data sources and plugins.
- Efficient Resource Usage: Prometheus efficiently utilizes resources, ensuring minimal impact on our cluster's performance.
Two common ways to use Prometheus and Grafana on Kubernetes:
- Manual Kubernetes deployment: In this method, we need to write Kubernetes Deployments and Services for both Prometheus and Grafana. In the YAML file, we need to put all the settings for Prometheus and Grafana on Kubernetes. Then we send these files to our Kubernetes cluster. But we can end up with many YAML files, which can be hard. If we make a mistake in any YAML file, Prometheus and Grafana won't work on Kubernetes.
- Using Helm: This is an easy way to send any application container to Kubernetes. Helm is the official package manager for Kubernetes. With Helm, we can make installing, sending, and managing Kubernetes makes applications easier.
A Helm Chart has all the YAML files:
- Deployments.
- Services.
- Secrets.
- ConfigMaps manifests.
We use these files to send the application container to Kubernetes. Instead of making individual YAML files for each application container, Helm lets us download Helm charts that already have YAML files.
Setting up Prometheus and Grafana using Helm chart
We will use ArtifactHub, which offers public and private repositories for Helm Charts. We will use these Helm Charts to arrange the pods and services in our Kubernetes cluster.
To get Prometheus and Grafana working on Kubernetes with Helm, we will start by installing Helm.
Installing Helm on Linux
sudo apt-get install helm
Installing Helm on Windows
choco install Kubernetes-helm
Installing Helm on macOS
brew install helm
We can check out the official Helm documentation if we run into any issues while installing Helm.
The image below represents the successful Helm installation on macOS.

For this blog, we’re going to install Helm chart and by default, this chart also installs additional, dependent charts (including Grafana):
- prometheus-community/kube-state-metrics
- prometheus-community/prometheus-node-exporter
- grafana/grafana
To get this Helm chart, let's run this command:
helm repo add prometheus-community https://prometheus-community.github.io/helm-charts
helm repo update

We have downloaded the latest version of Prometheus & Grafana.
To install the Prometheus Helm Chart on a Kubernetes Cluster, let's run the following command:
helm install my-kube-prometheus-stack prometheus-community/kube-prometheus-stack

We have successfully installed Prometheus & Grafana on the Kubernetes Cluster. We can access the Prometheus & Grafana servers via ports 9090 & 80, respectively.
Now, let's run the following command to view all the resources created by the Helm Chart in our Kubernetes cluster:
kubectl get all
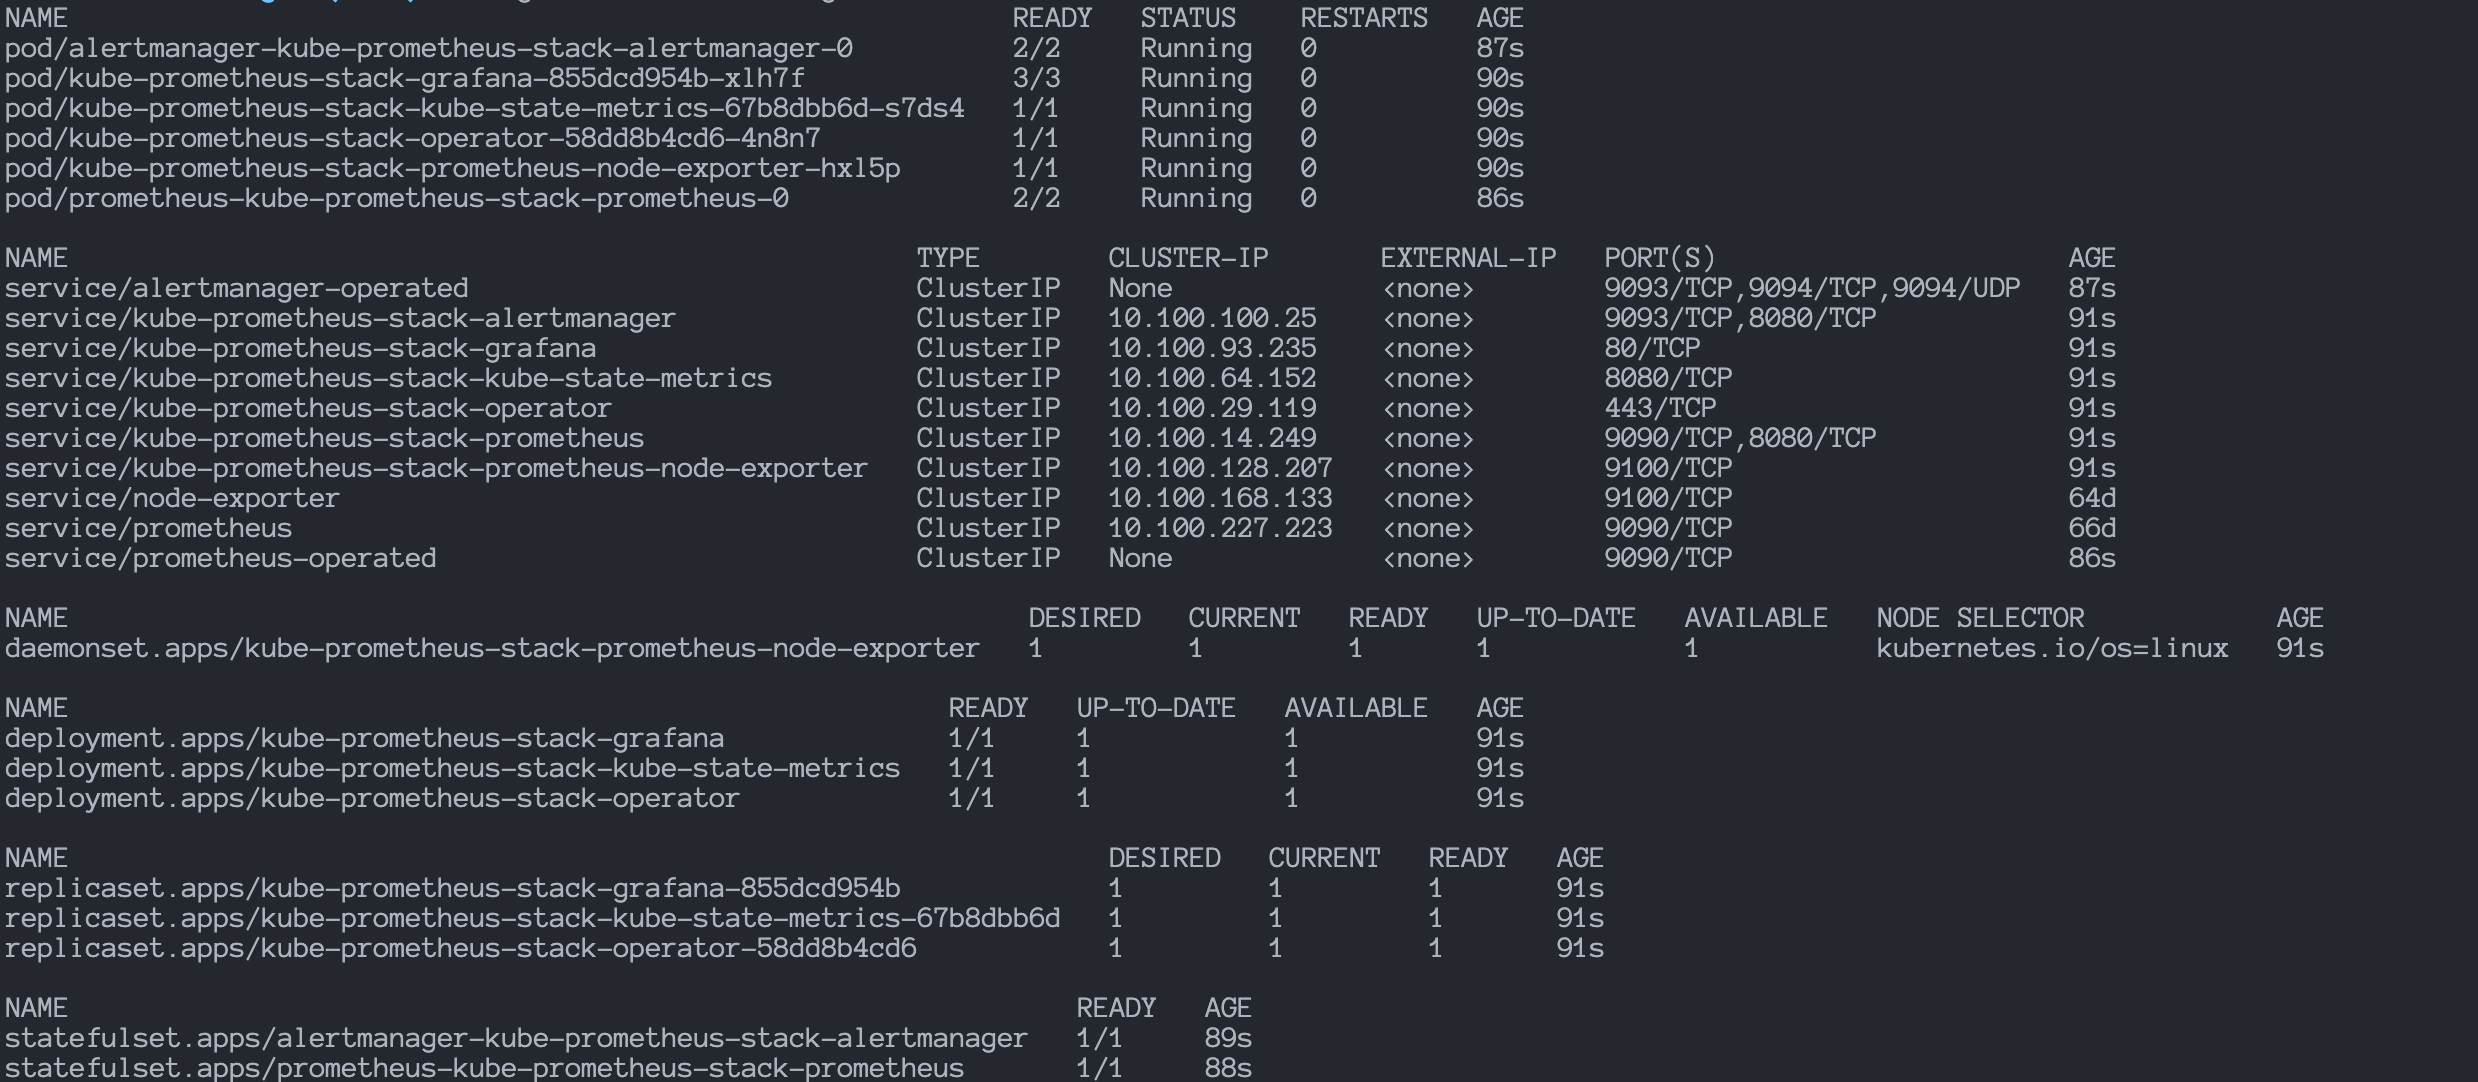 The Helm chart created the following resources:
- Pods: It hosts the deployed Prometheus Kubernetes application inside the cluster.
- Replica Sets: A collection of instances of the same application inside the Kubernetes cluster. It enhances application reliability.
- Deployments: It is the blueprint for creating the application pods.
- Services: It exposes the pods running inside the Kubernetes cluster. We use it to access the deployed Kubernetes application.
- Stateful Sets: They manage the deployment of the stateful application components and ensure stable and predictable network identities for these components.
- Daemon Sets: They ensure that all (or a specific set of) nodes run a copy of a pod, which is useful for tasks such as logging, monitoring, and other node-specific operations.
Run this command to view all the Kubernetes Services for Prometheus & Grafana:
kubectl get service

Listed services for Prometheus and Grafana are:
- alertmanager-operated
- kube-prometheus-stack-alertmanager
- kube-prometheus-stack-grafana
- kube-prometheus-stack-kube-state-metrics
- kube-prometheus-stack-operator
- kube-prometheus-stack-prometheus
- kube-prometheus-stack-prometheus-node-exporter
- prometheus-operated
kube-prometheus-stack-grafana and kube-prometheus-stack-prometheus are the
ClusterIP type services, which means we can only access them within the
Kubernetes cluster.
To expose the Prometheus and Grafana to be accessed outside the Kubernetes cluster , we can either use the NodeIP or LoadBalance service.
Exposing Prometheus and Grafana using NodePort services
Let's run the following command to expose the Prometheus Kubernetes service:
kubectl expose service kube-prometheus-stack-prometheus --type=NodePort --target-port=9090 --name=prometheus-node-port-service

kubectl expose service kube-prometheus-stack-grafana --type=NodePort --target-port=3000 --name=grafana-node-port-service
That command will create new services of NodePort type & make the Prometheus
and Grafana is accessible outside the Kubernetes Cluster on ports 9090 and
80.

As we can see, the grafana-node-port-service and
prometheus-node-port-service are successfully created and are being exposed on
node ports 32489 & 30905
Now, we can run this command and get the external IP of any node to access the Prometheus and Grafana:
kubectl get nodes -o wide

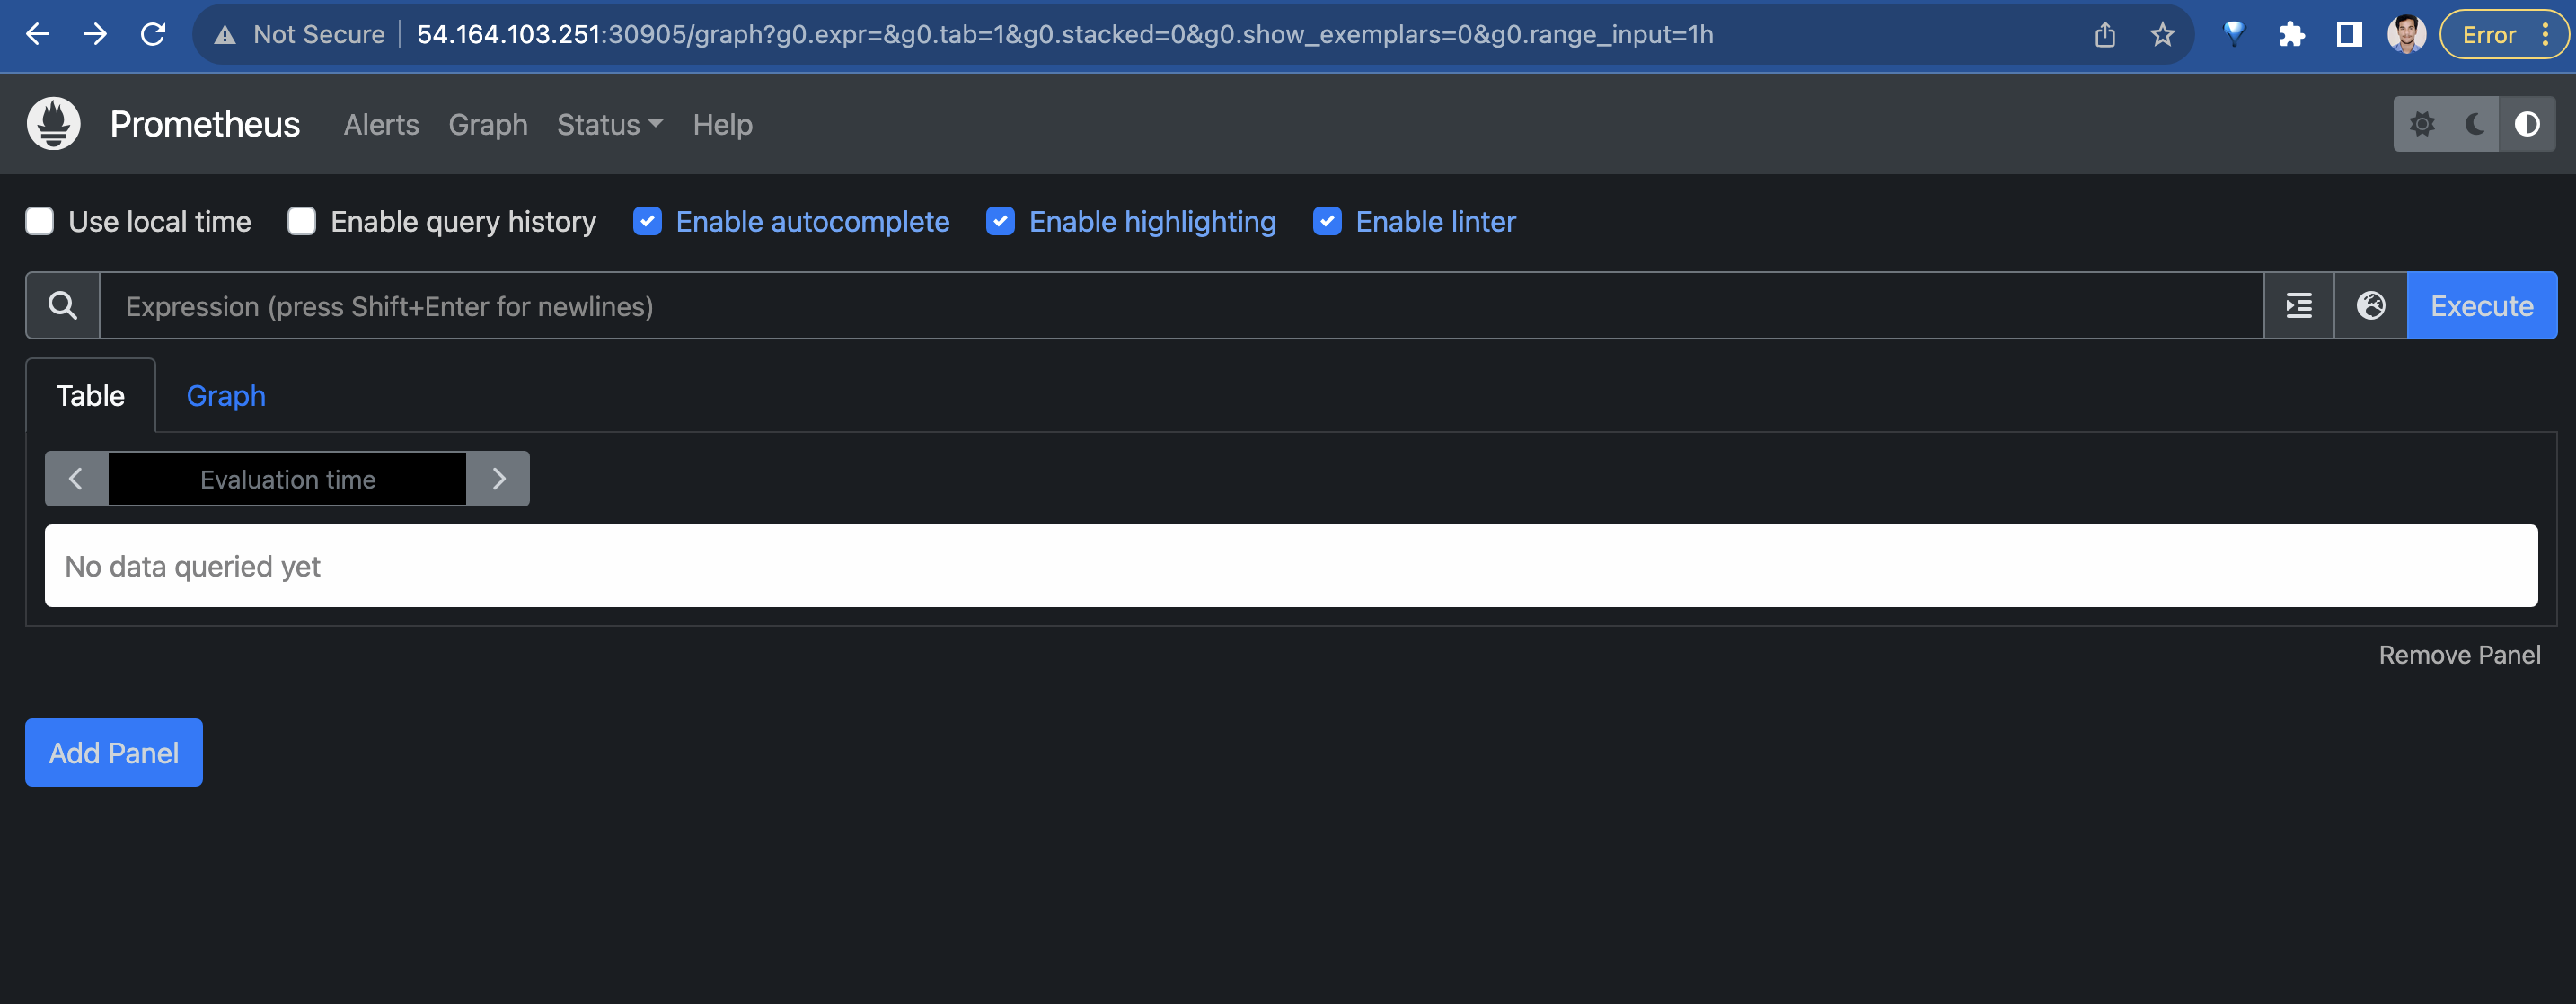
We can use the External-IP and the node ports to access the Prometheus and Grafana dashboards outside the cluster environment.
Prometheus Dashboard
Grafana Dashboard
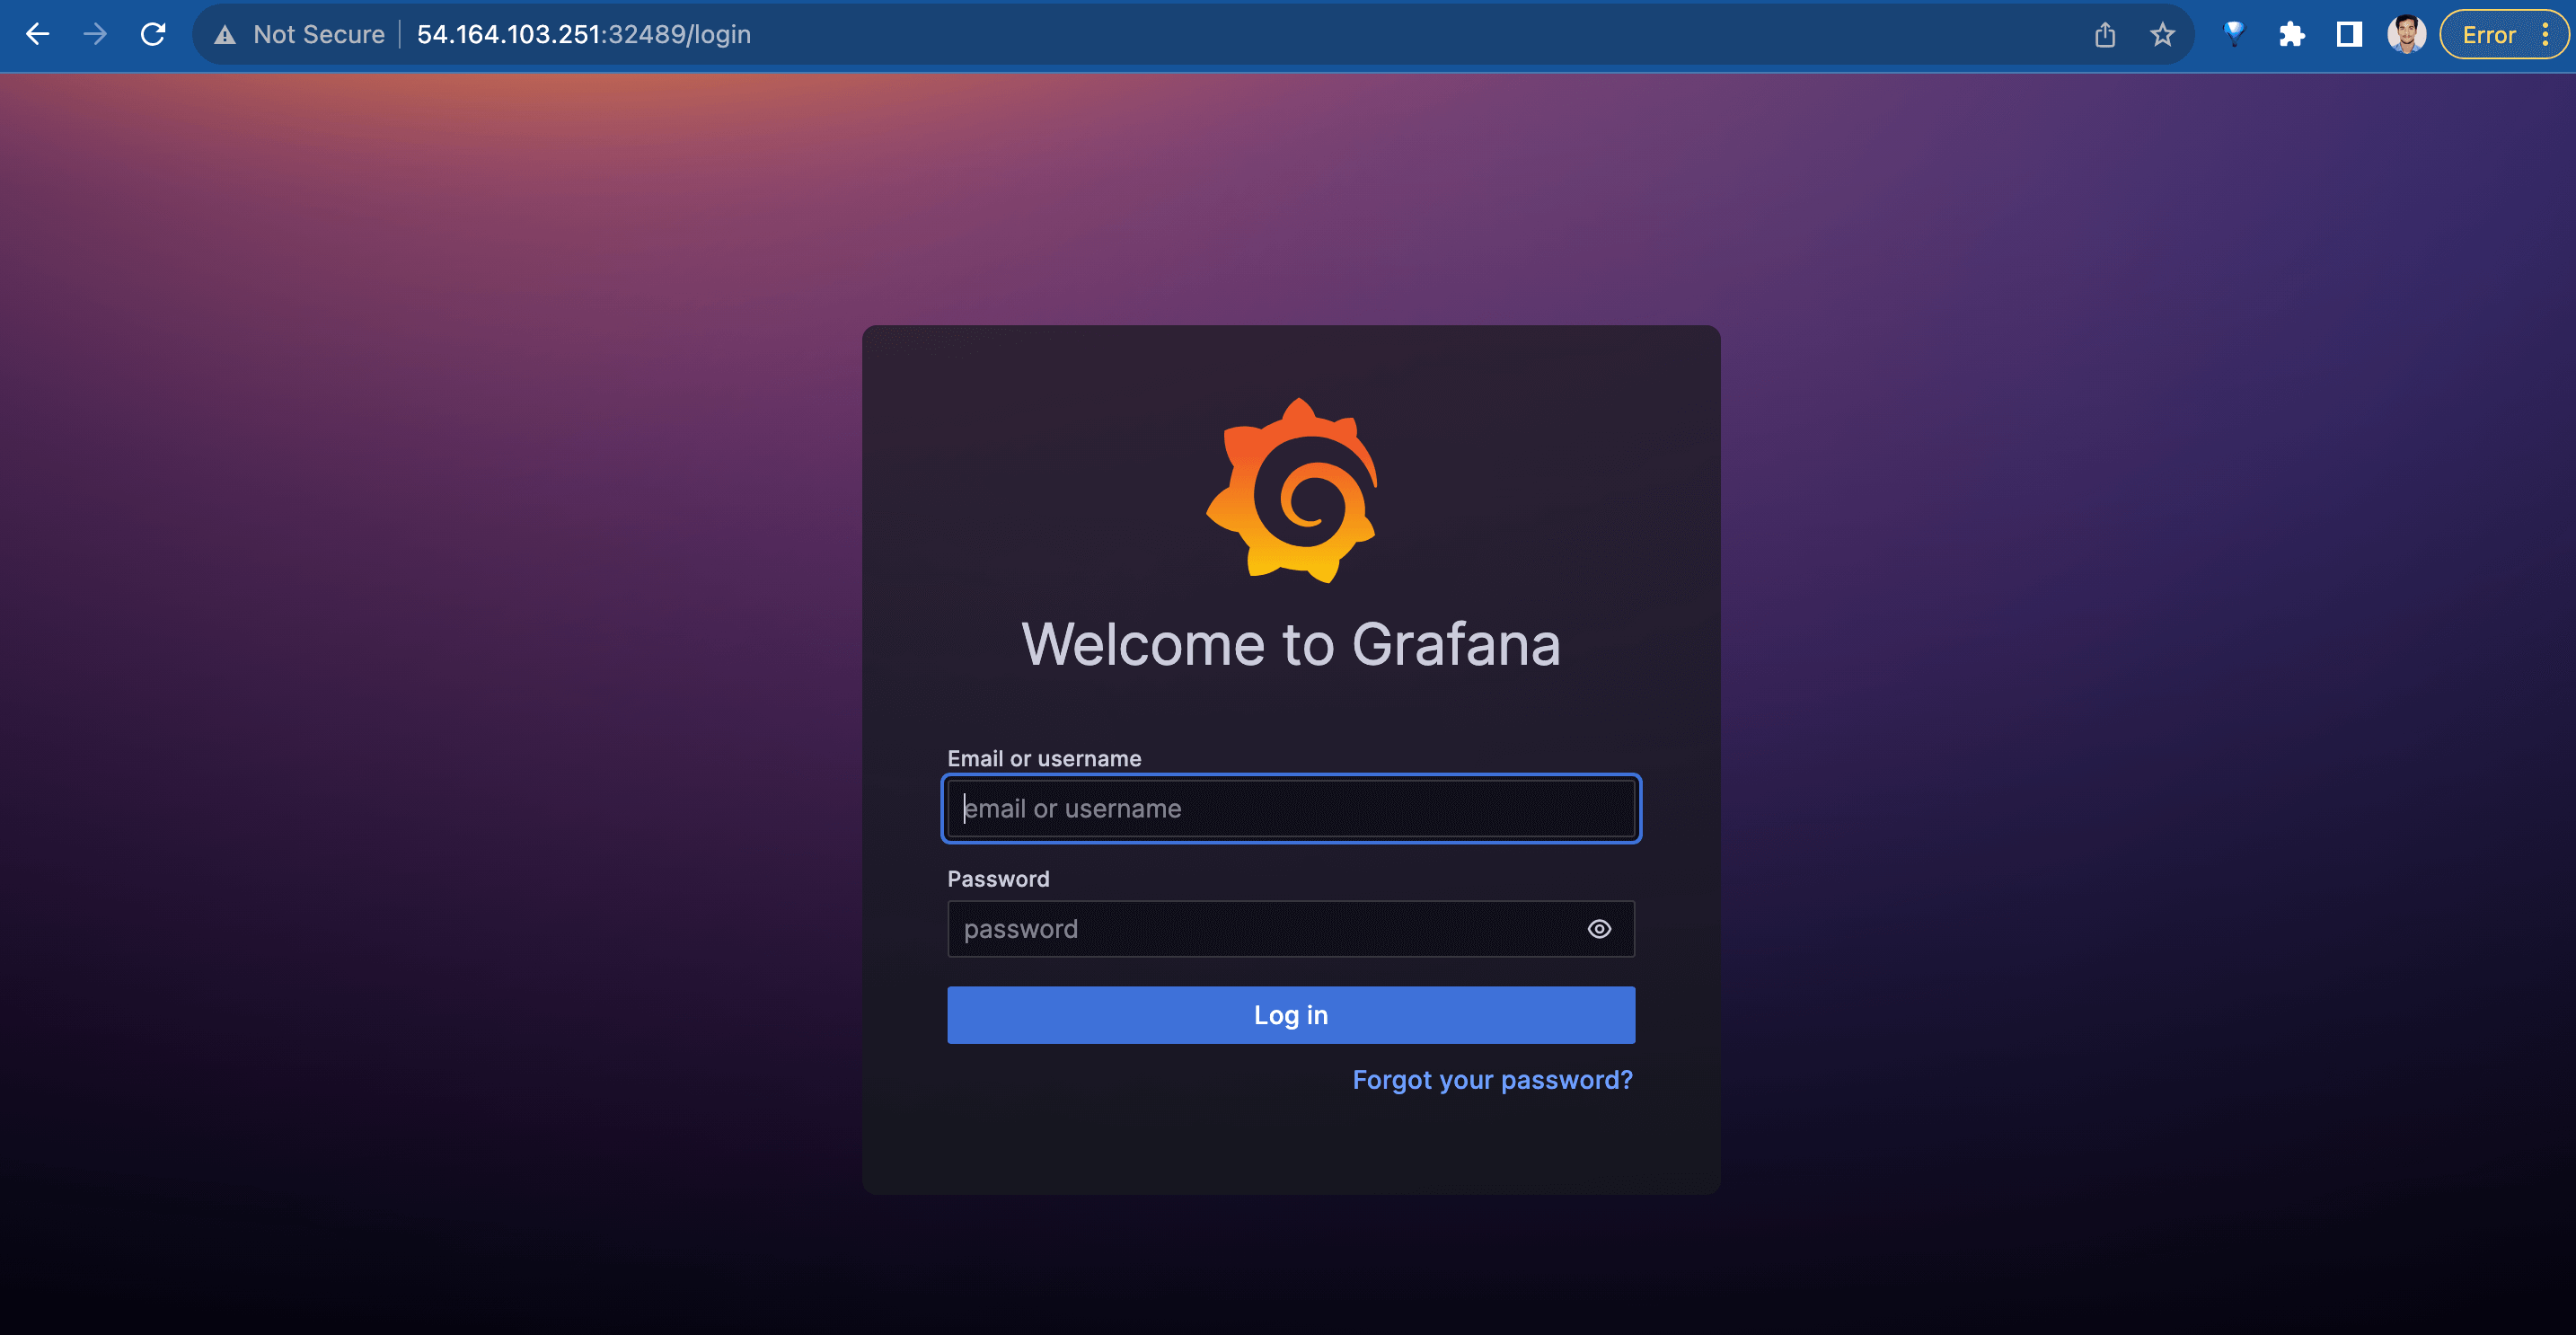
Run this command, to get the password for the admin user of the Grafana dashboard:
kubectl get secret --namespace default kube-prometheus-stack-grafana -o jsonpath="{.data.admin-password}" | base64 --decode ; echo
Grafana Dashboard
Upon login to the Grafana dashboard, use admin as the username and our
generated password. We will see "Welcome to Grafana" homepage as shown below.
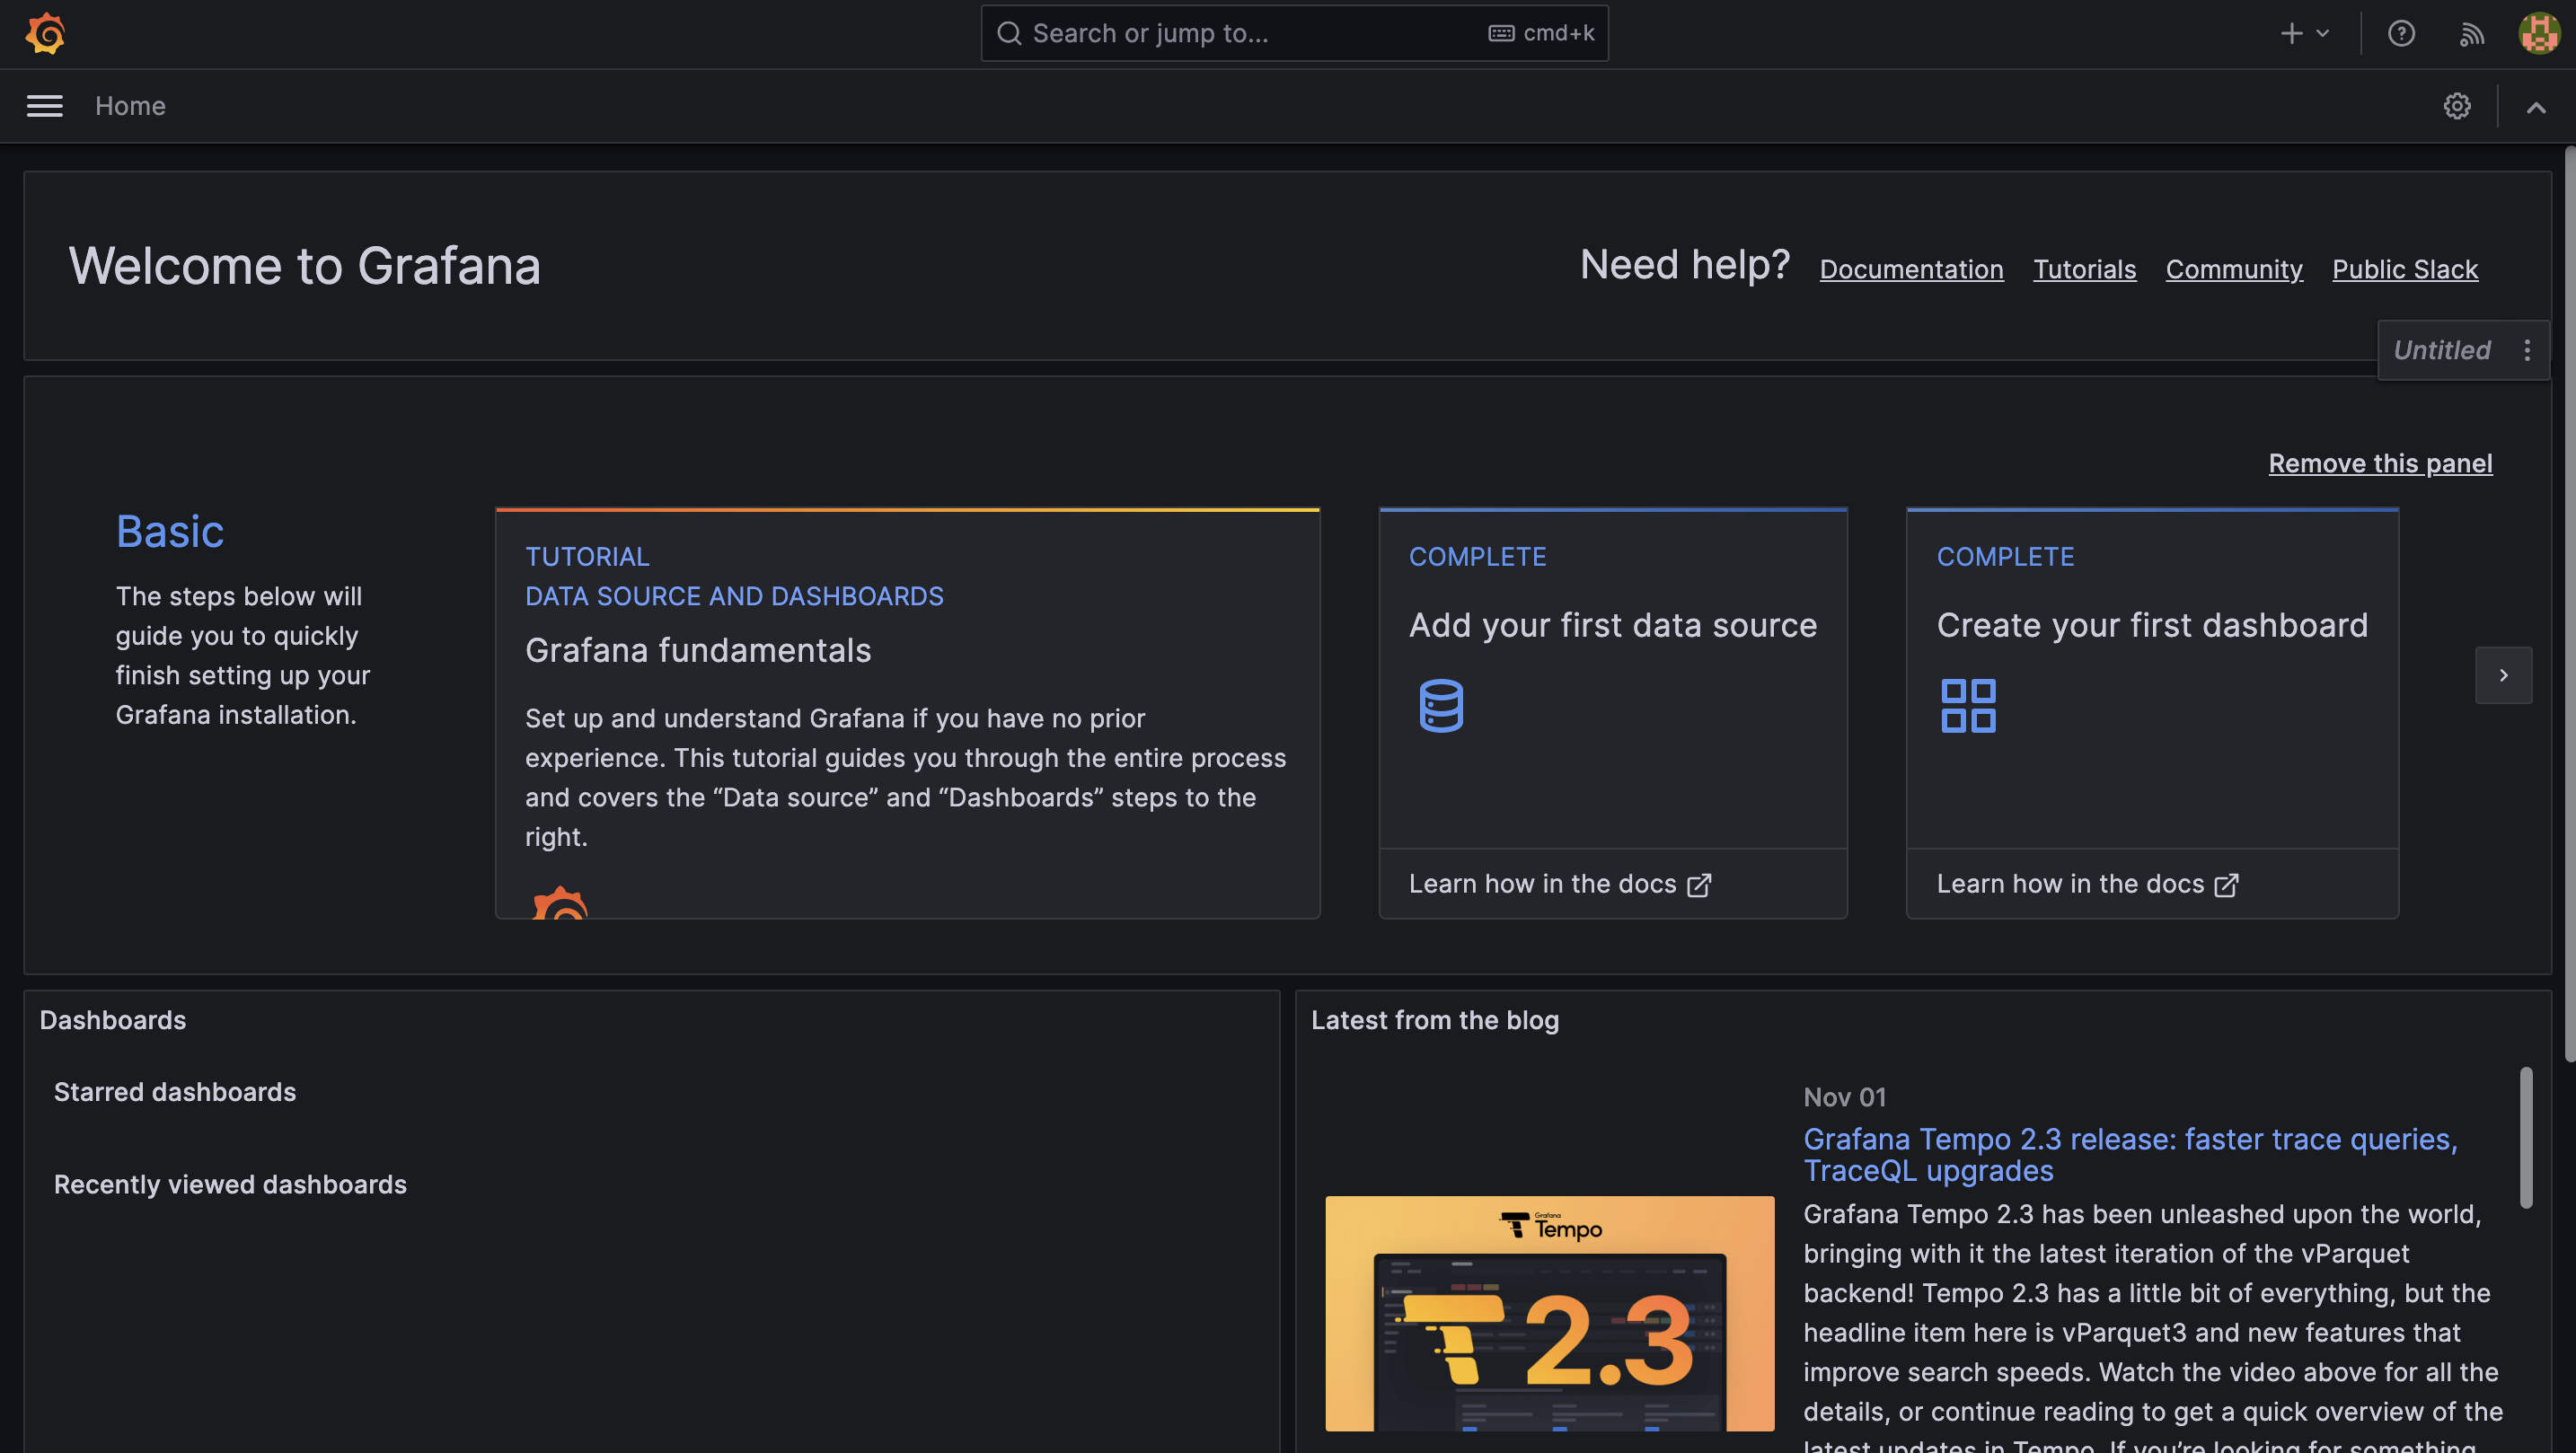
Since we used the Kube Prometheus Stack helm chart, the data source for Prometheus and Alert Manager is added by default.
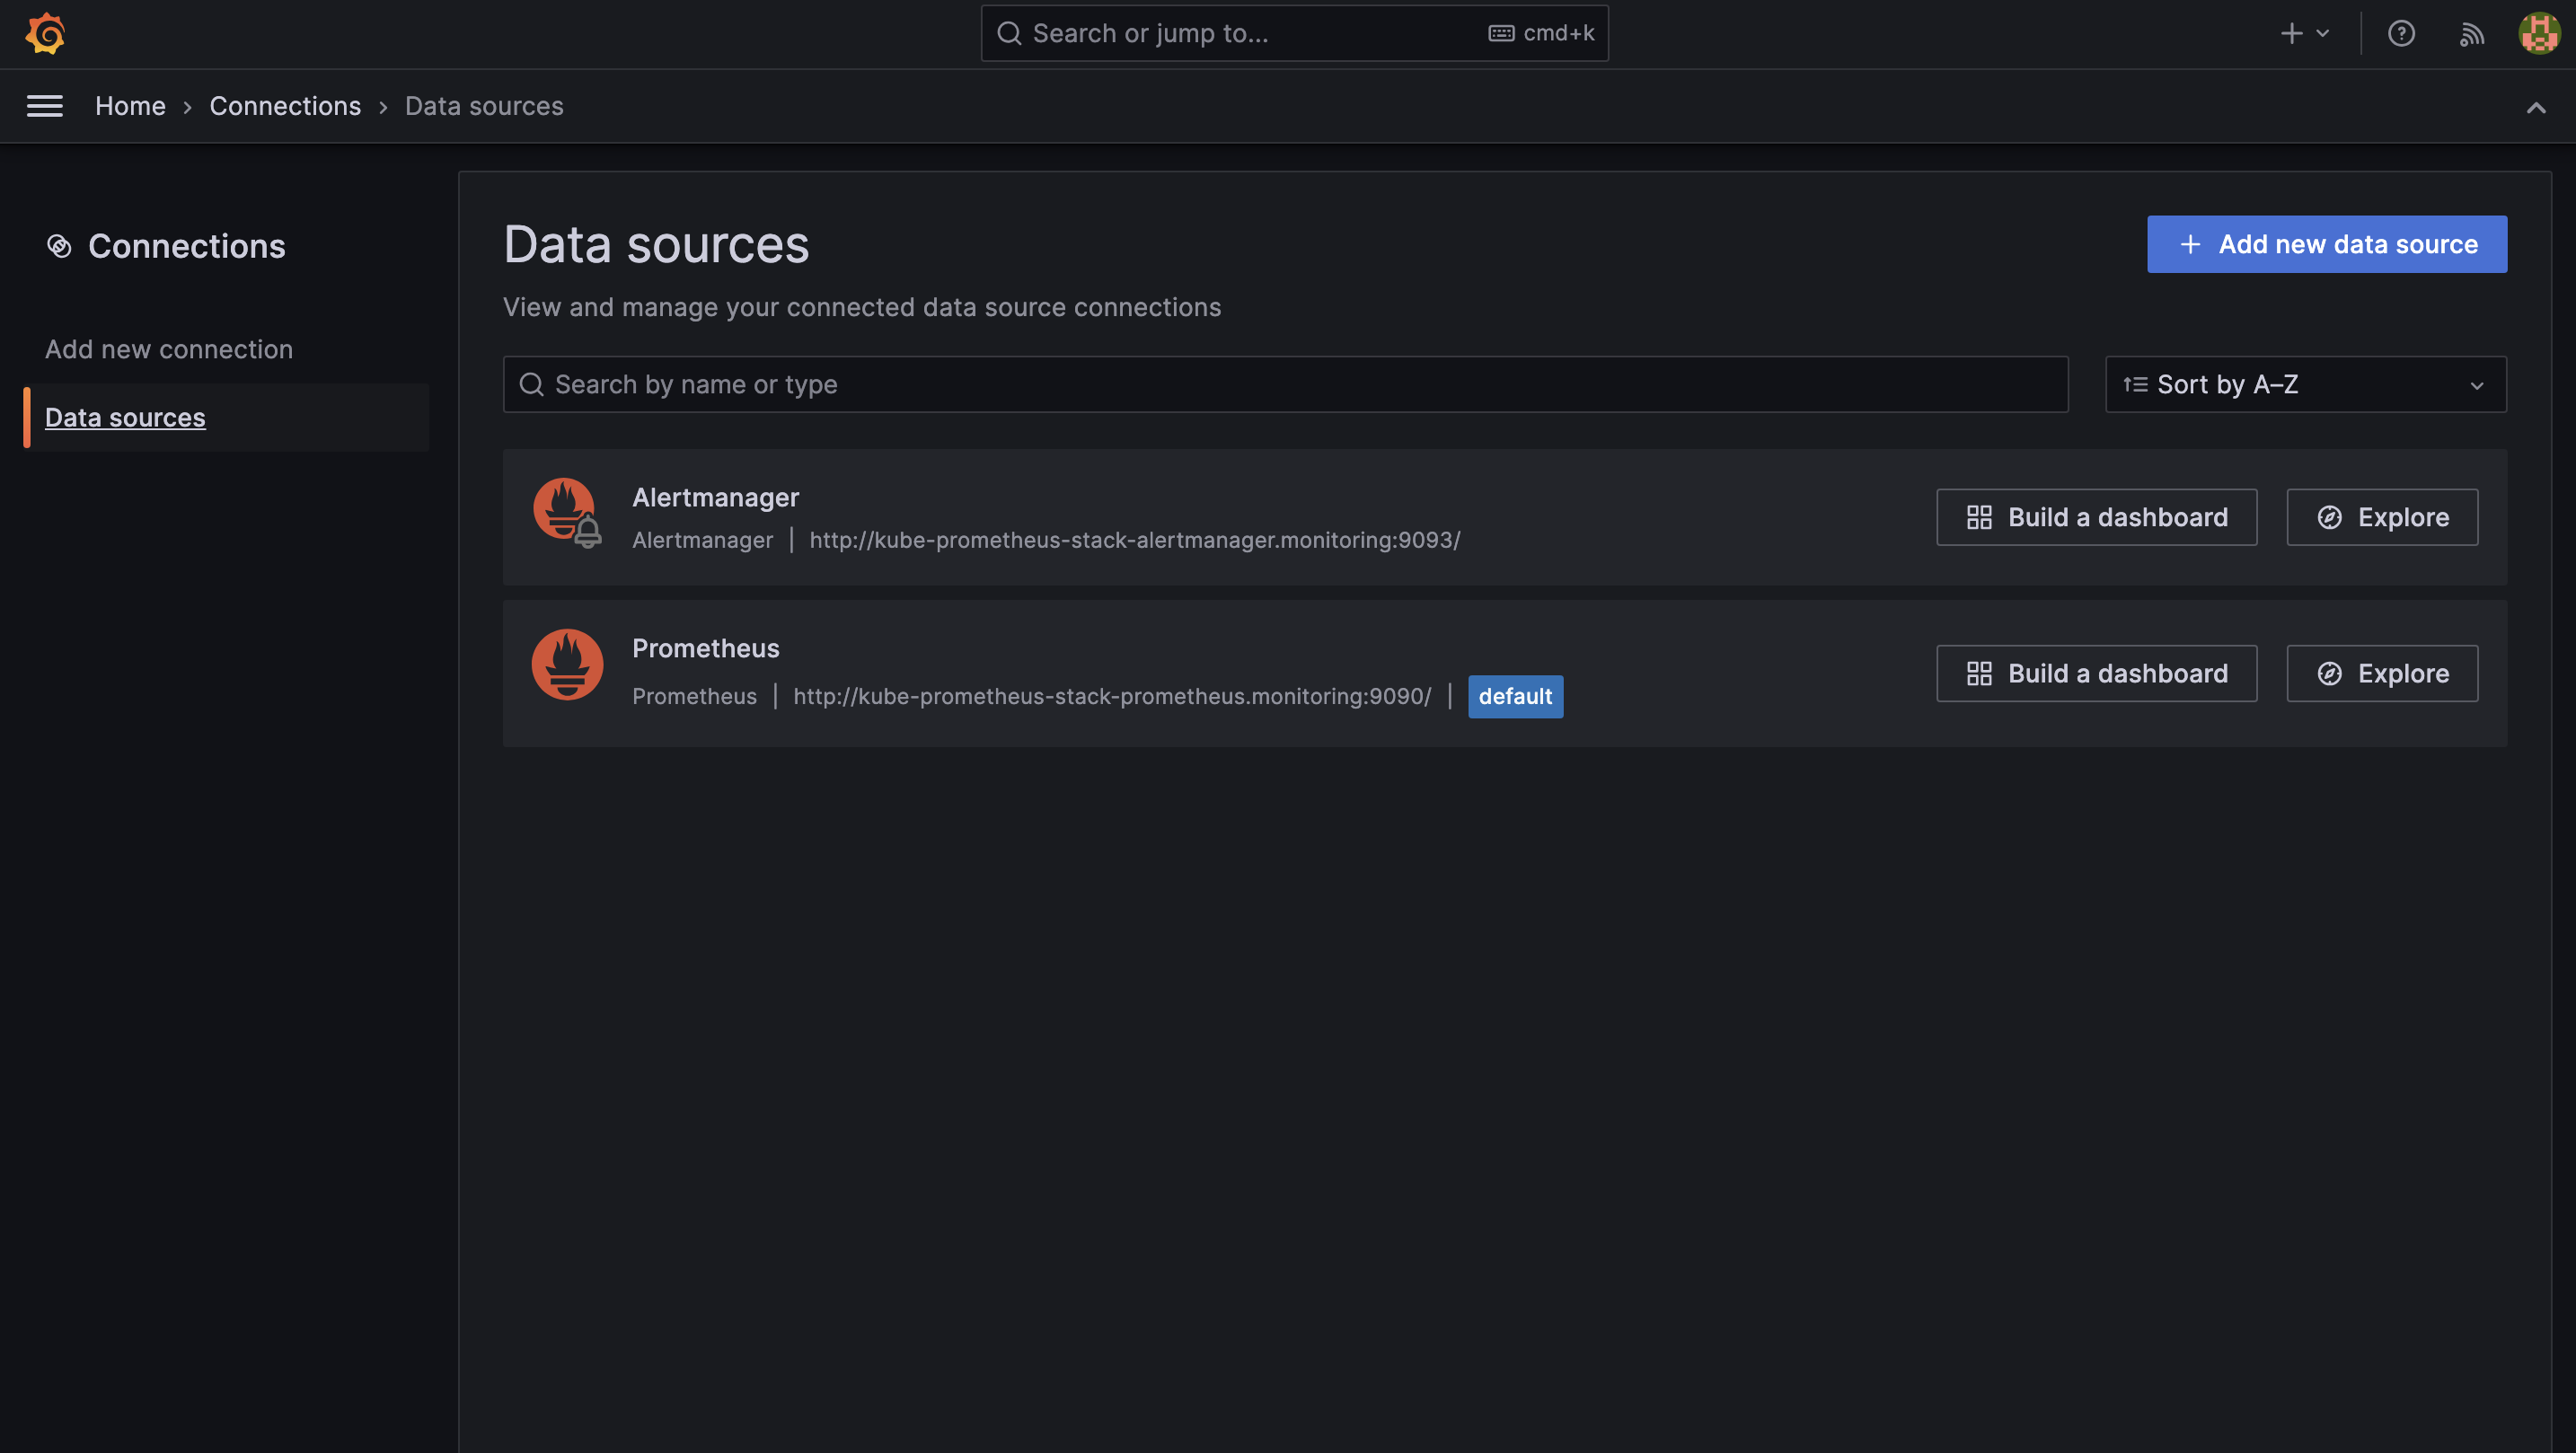
We can add more data sources by clicking on the Add new data source button on the top right side.
By default, this Helm chart adds multiple dashboards to monitor the health of the Kubernetes cluster and its resources.
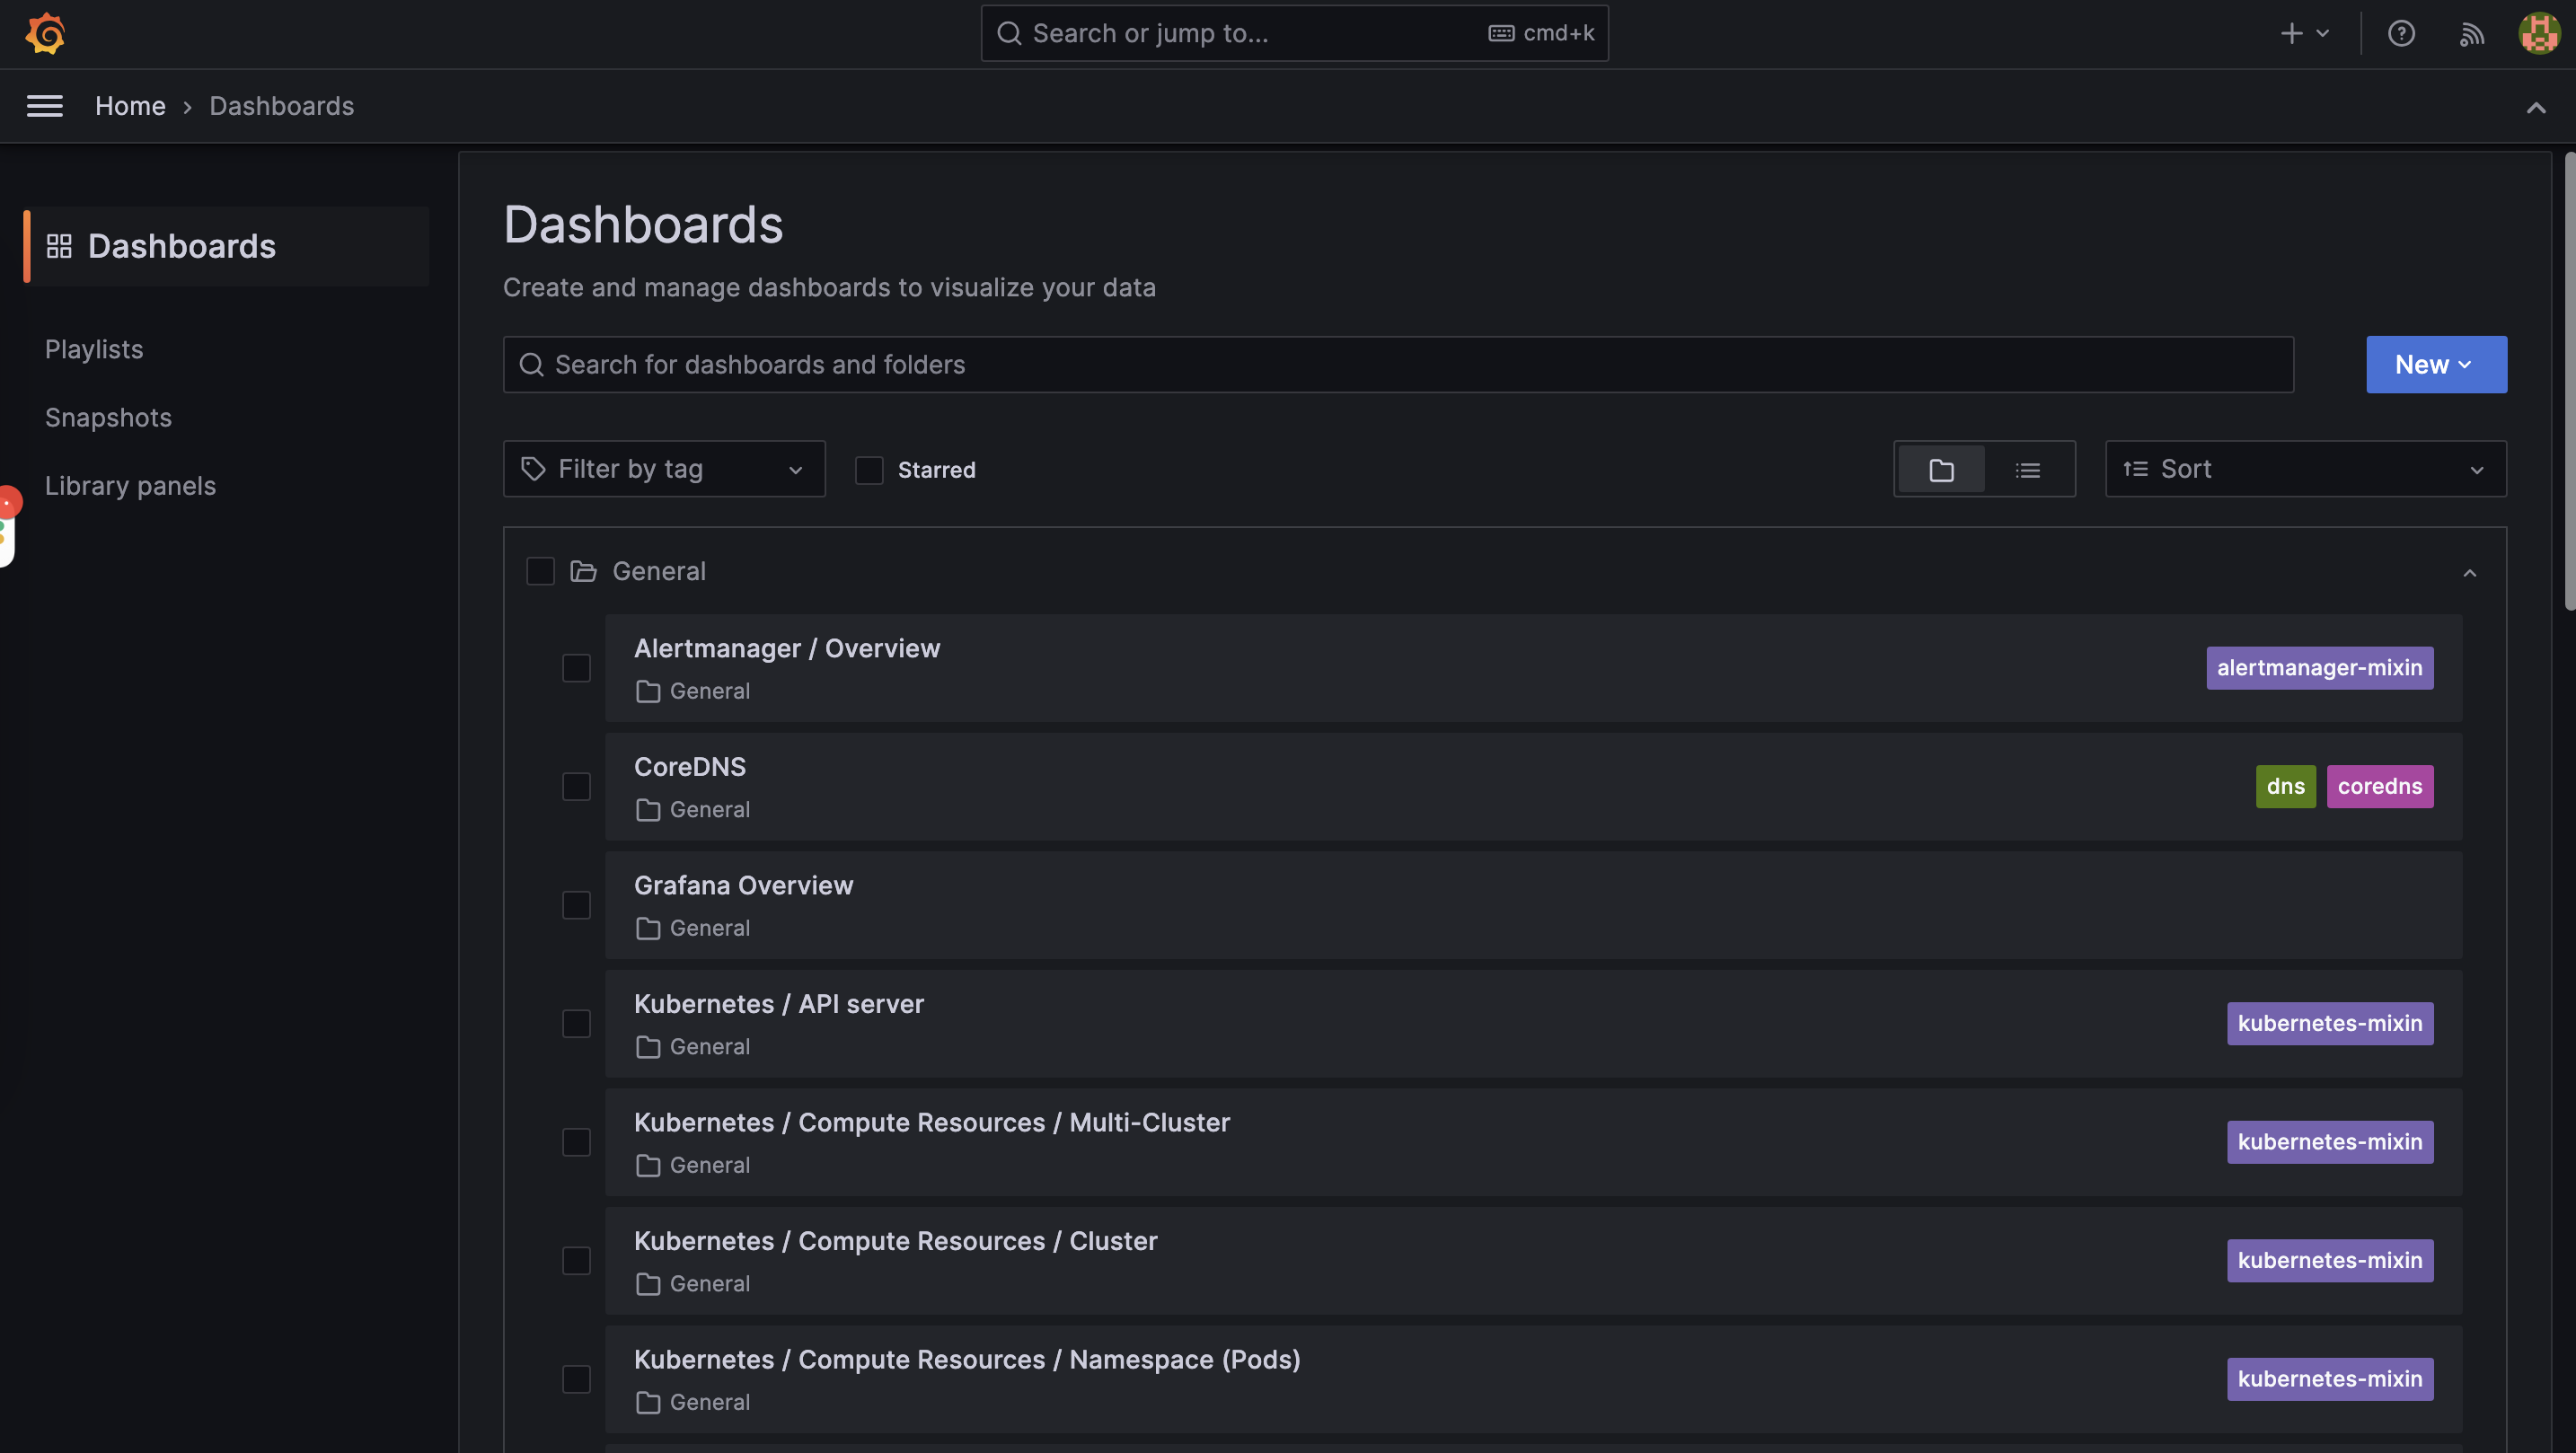
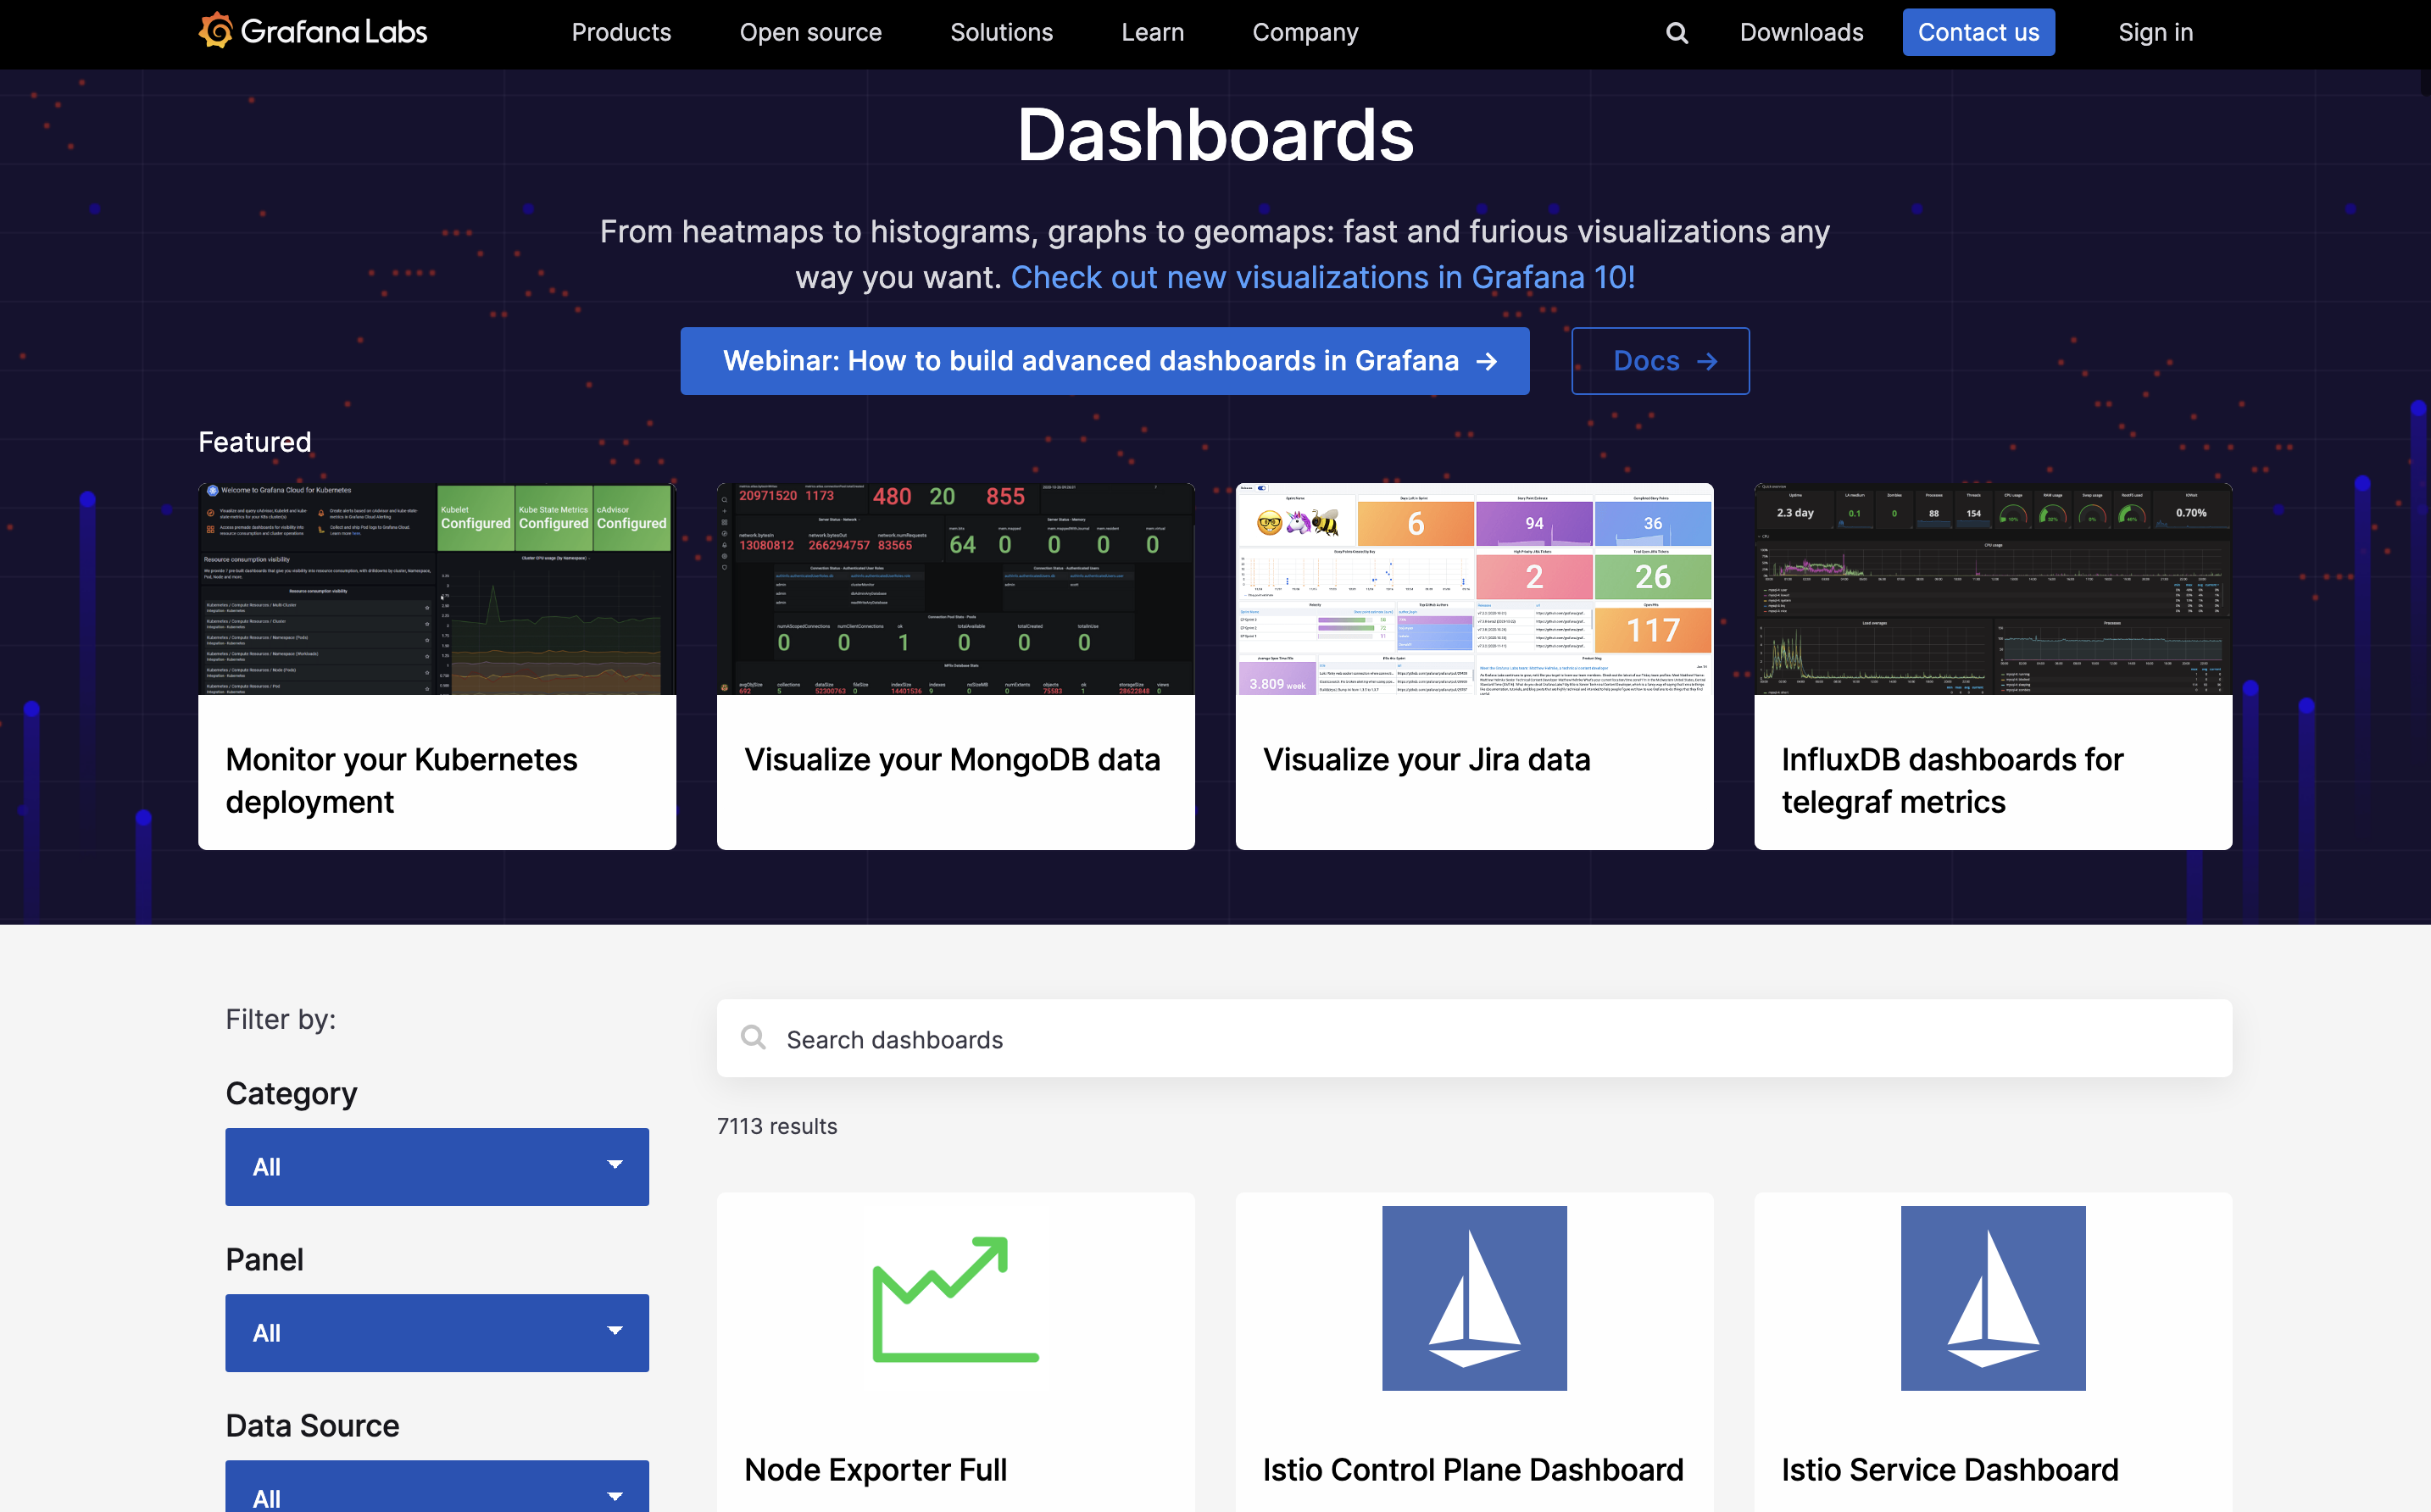
Additionally, we also have the option of creating our dashboards from scratch as well as importing multiple Grafana dashboards provided by the Grafana library.
To import a Grafana Dashboard, let's follow these steps:
-
From this Grafana library, we can add any dashboard
-
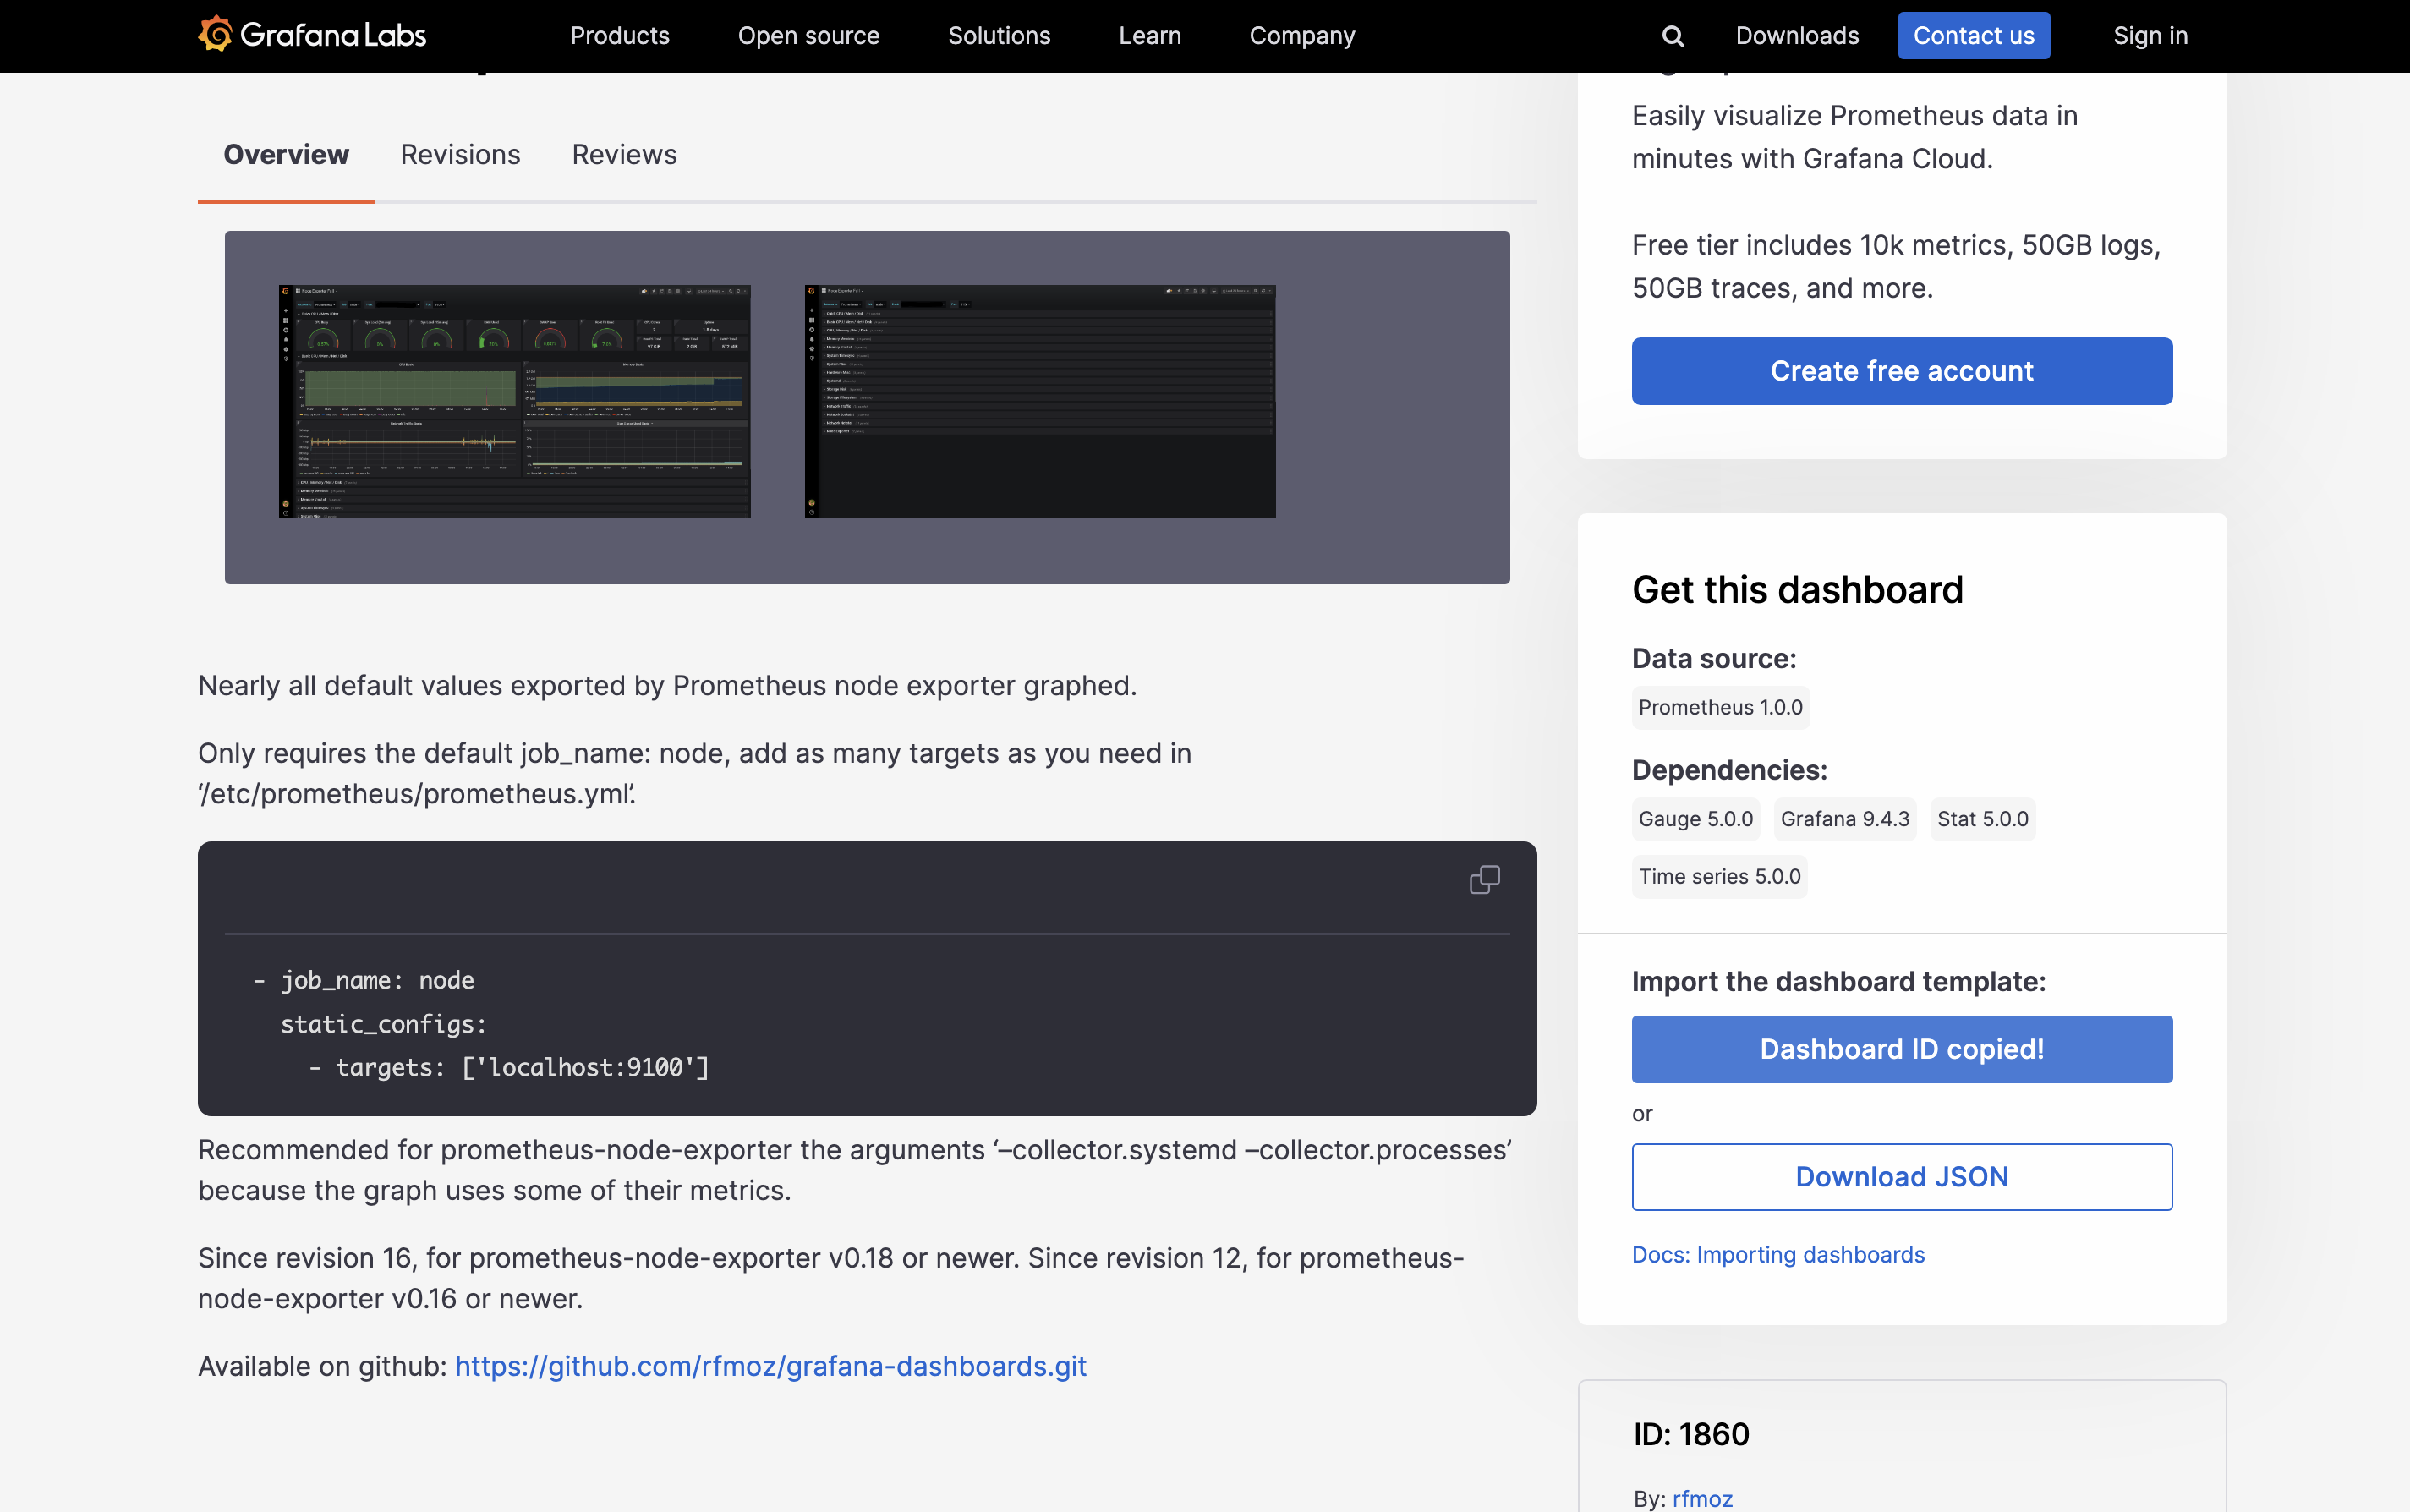
Select Dashboard and copy the Dashboard ID
-
Under Dashboards page we can get the Import option
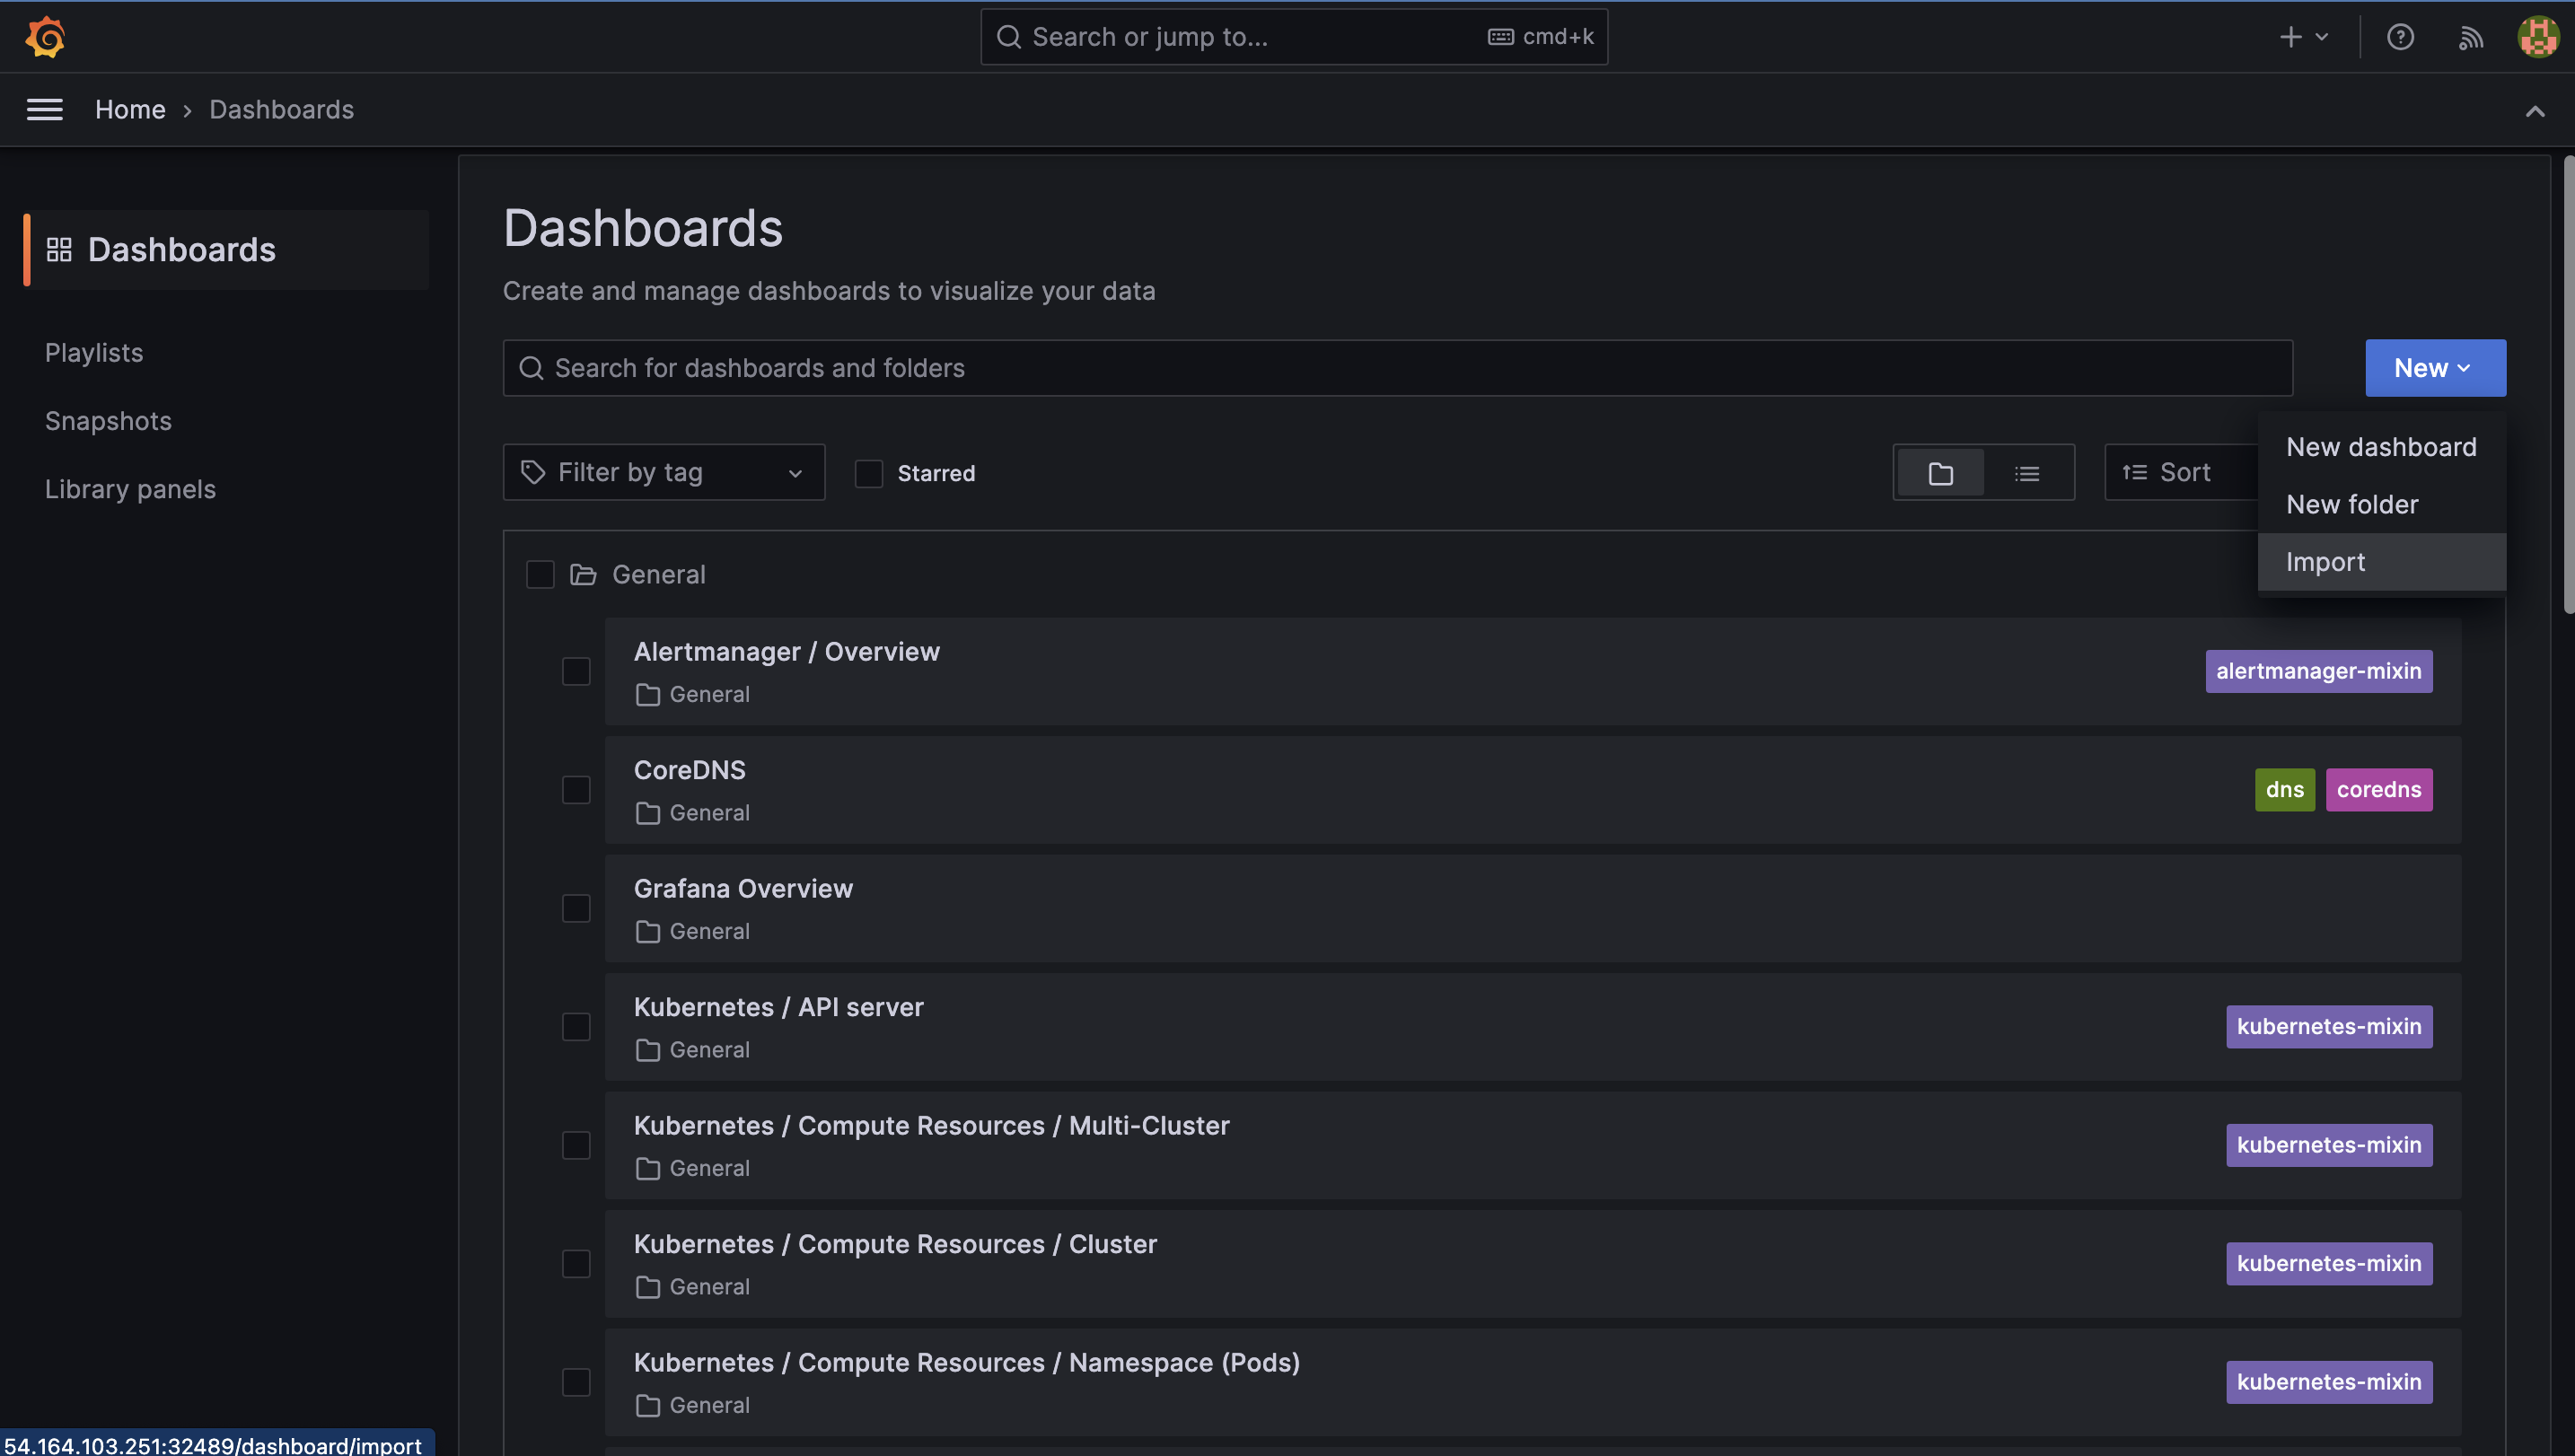
-
Under "Import Dashboard" page, we need to paste the Dashboard IP that we copied earlier & click on the Load button.
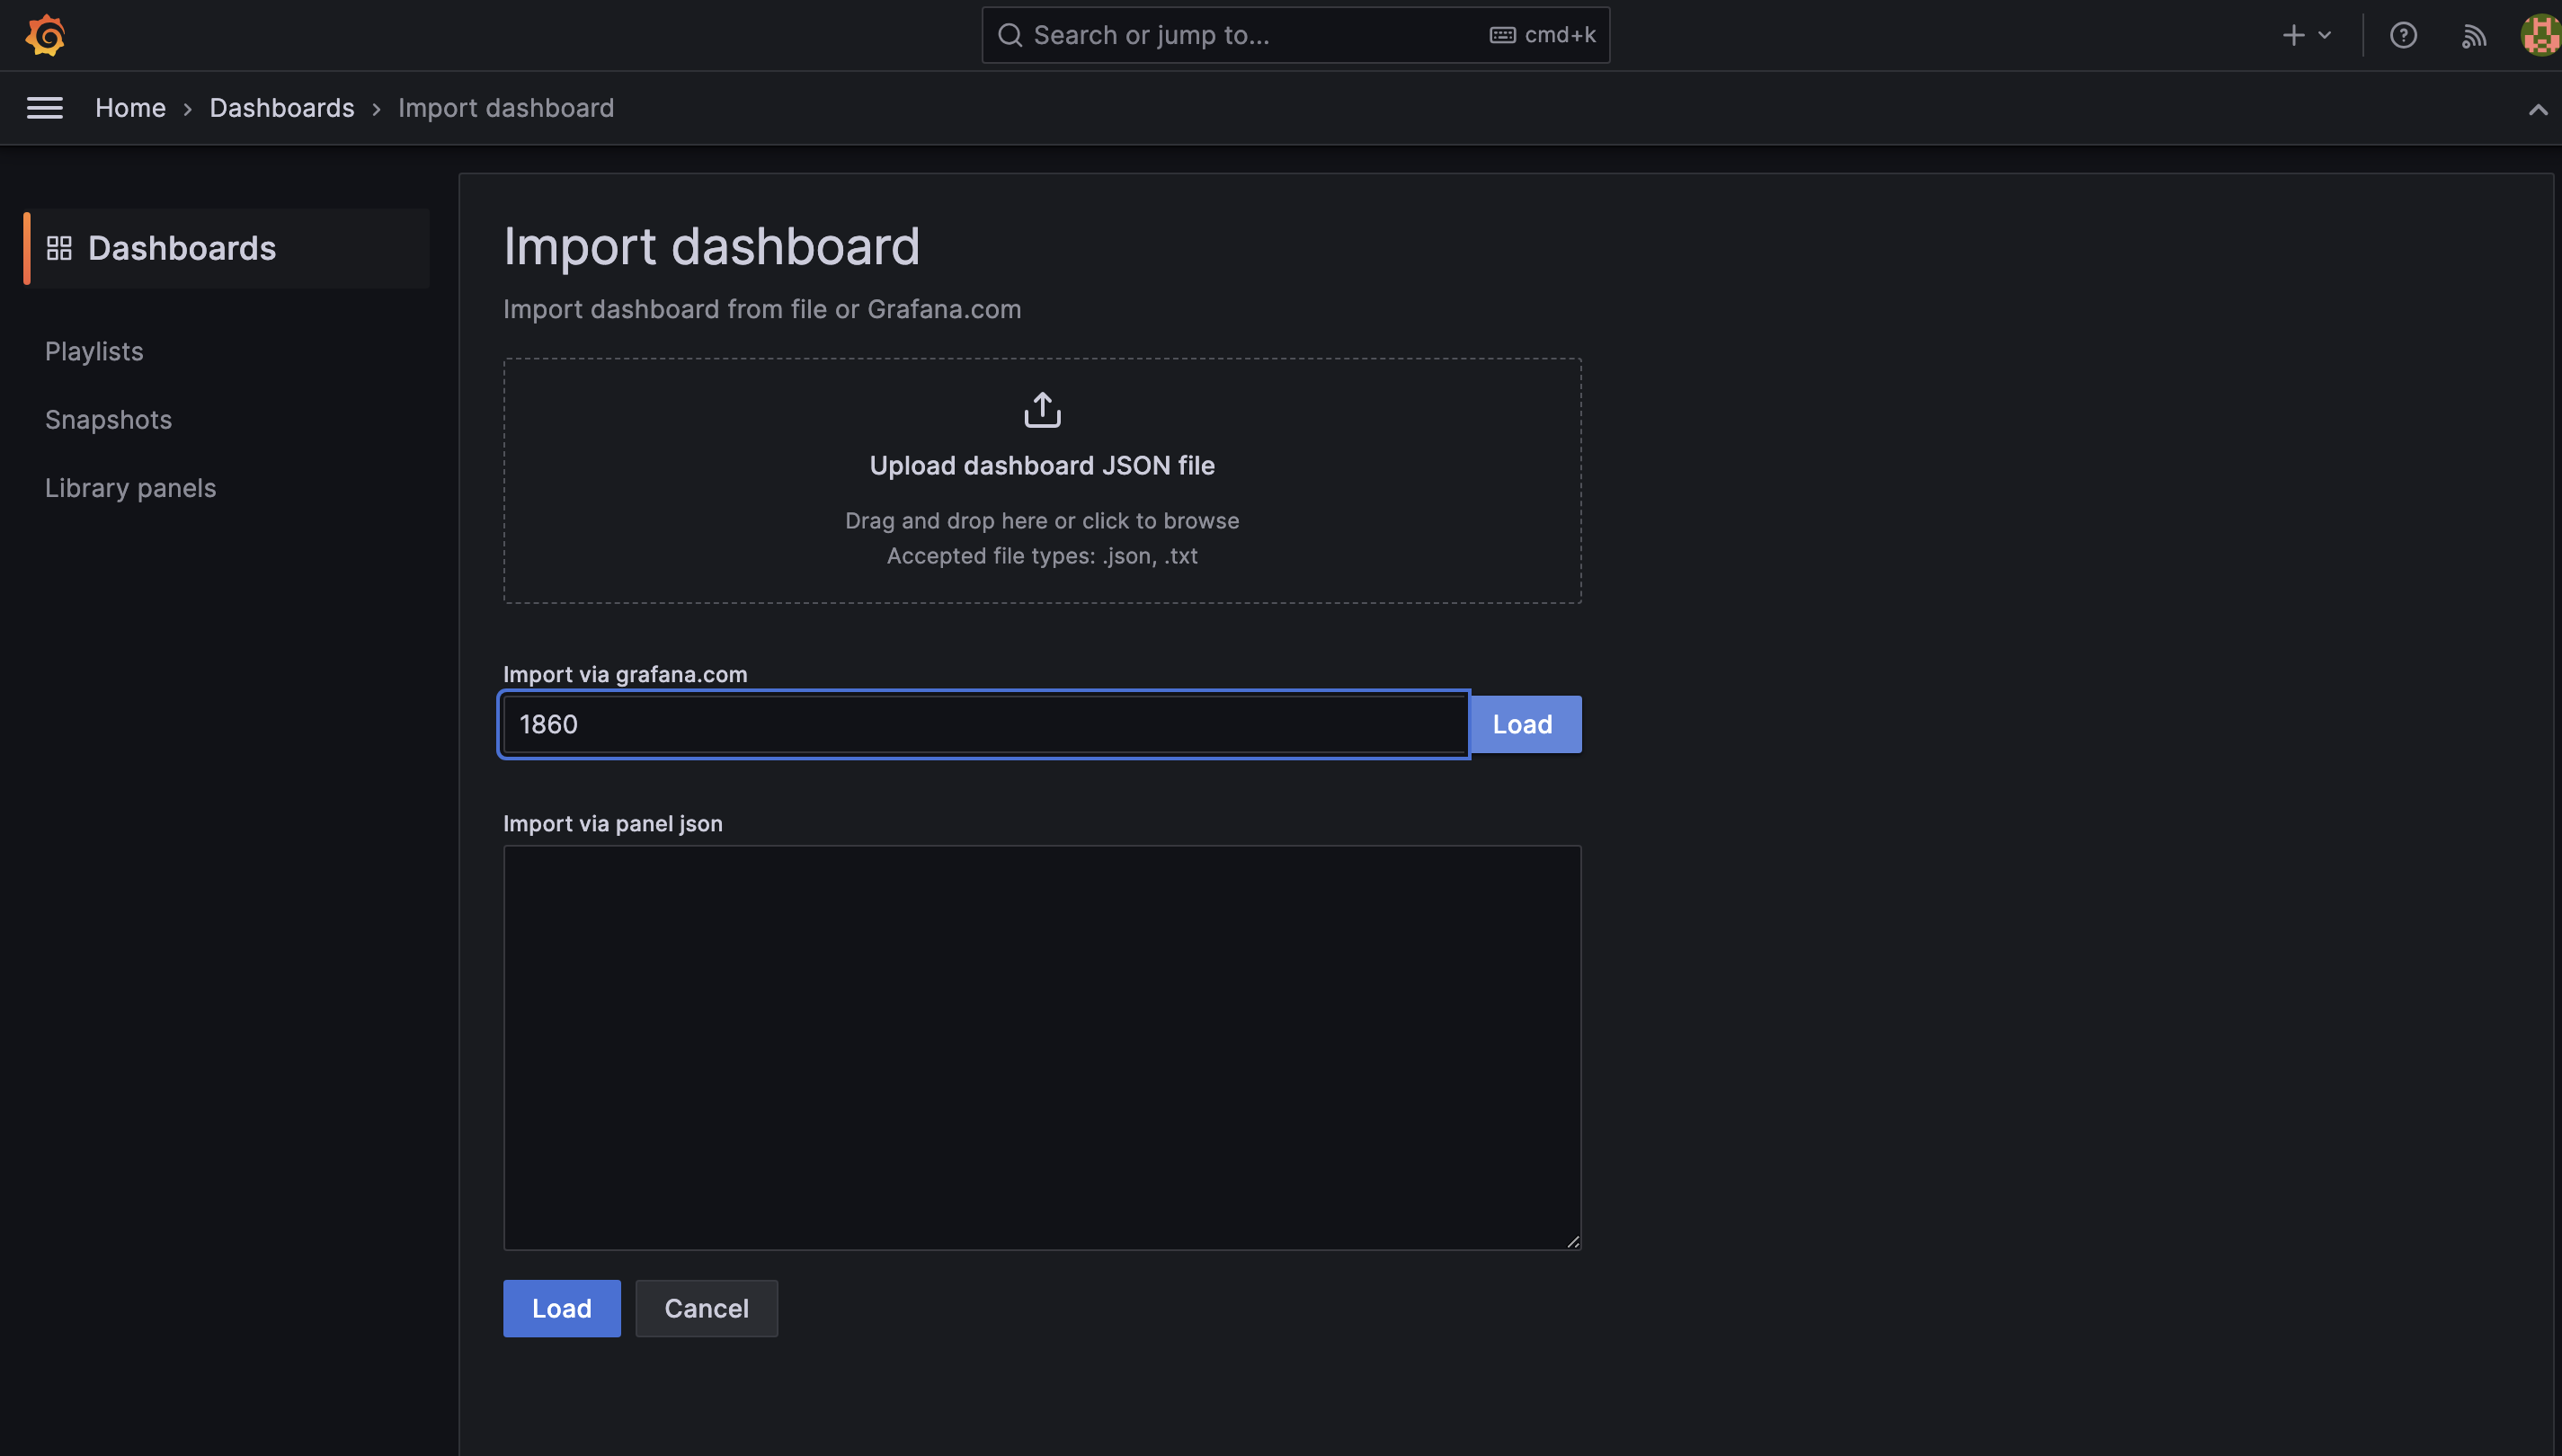
-
After clicking on the Load button, it will auto-load the dashboard from the library after which we can import the dashboard by clicking on the Import button.
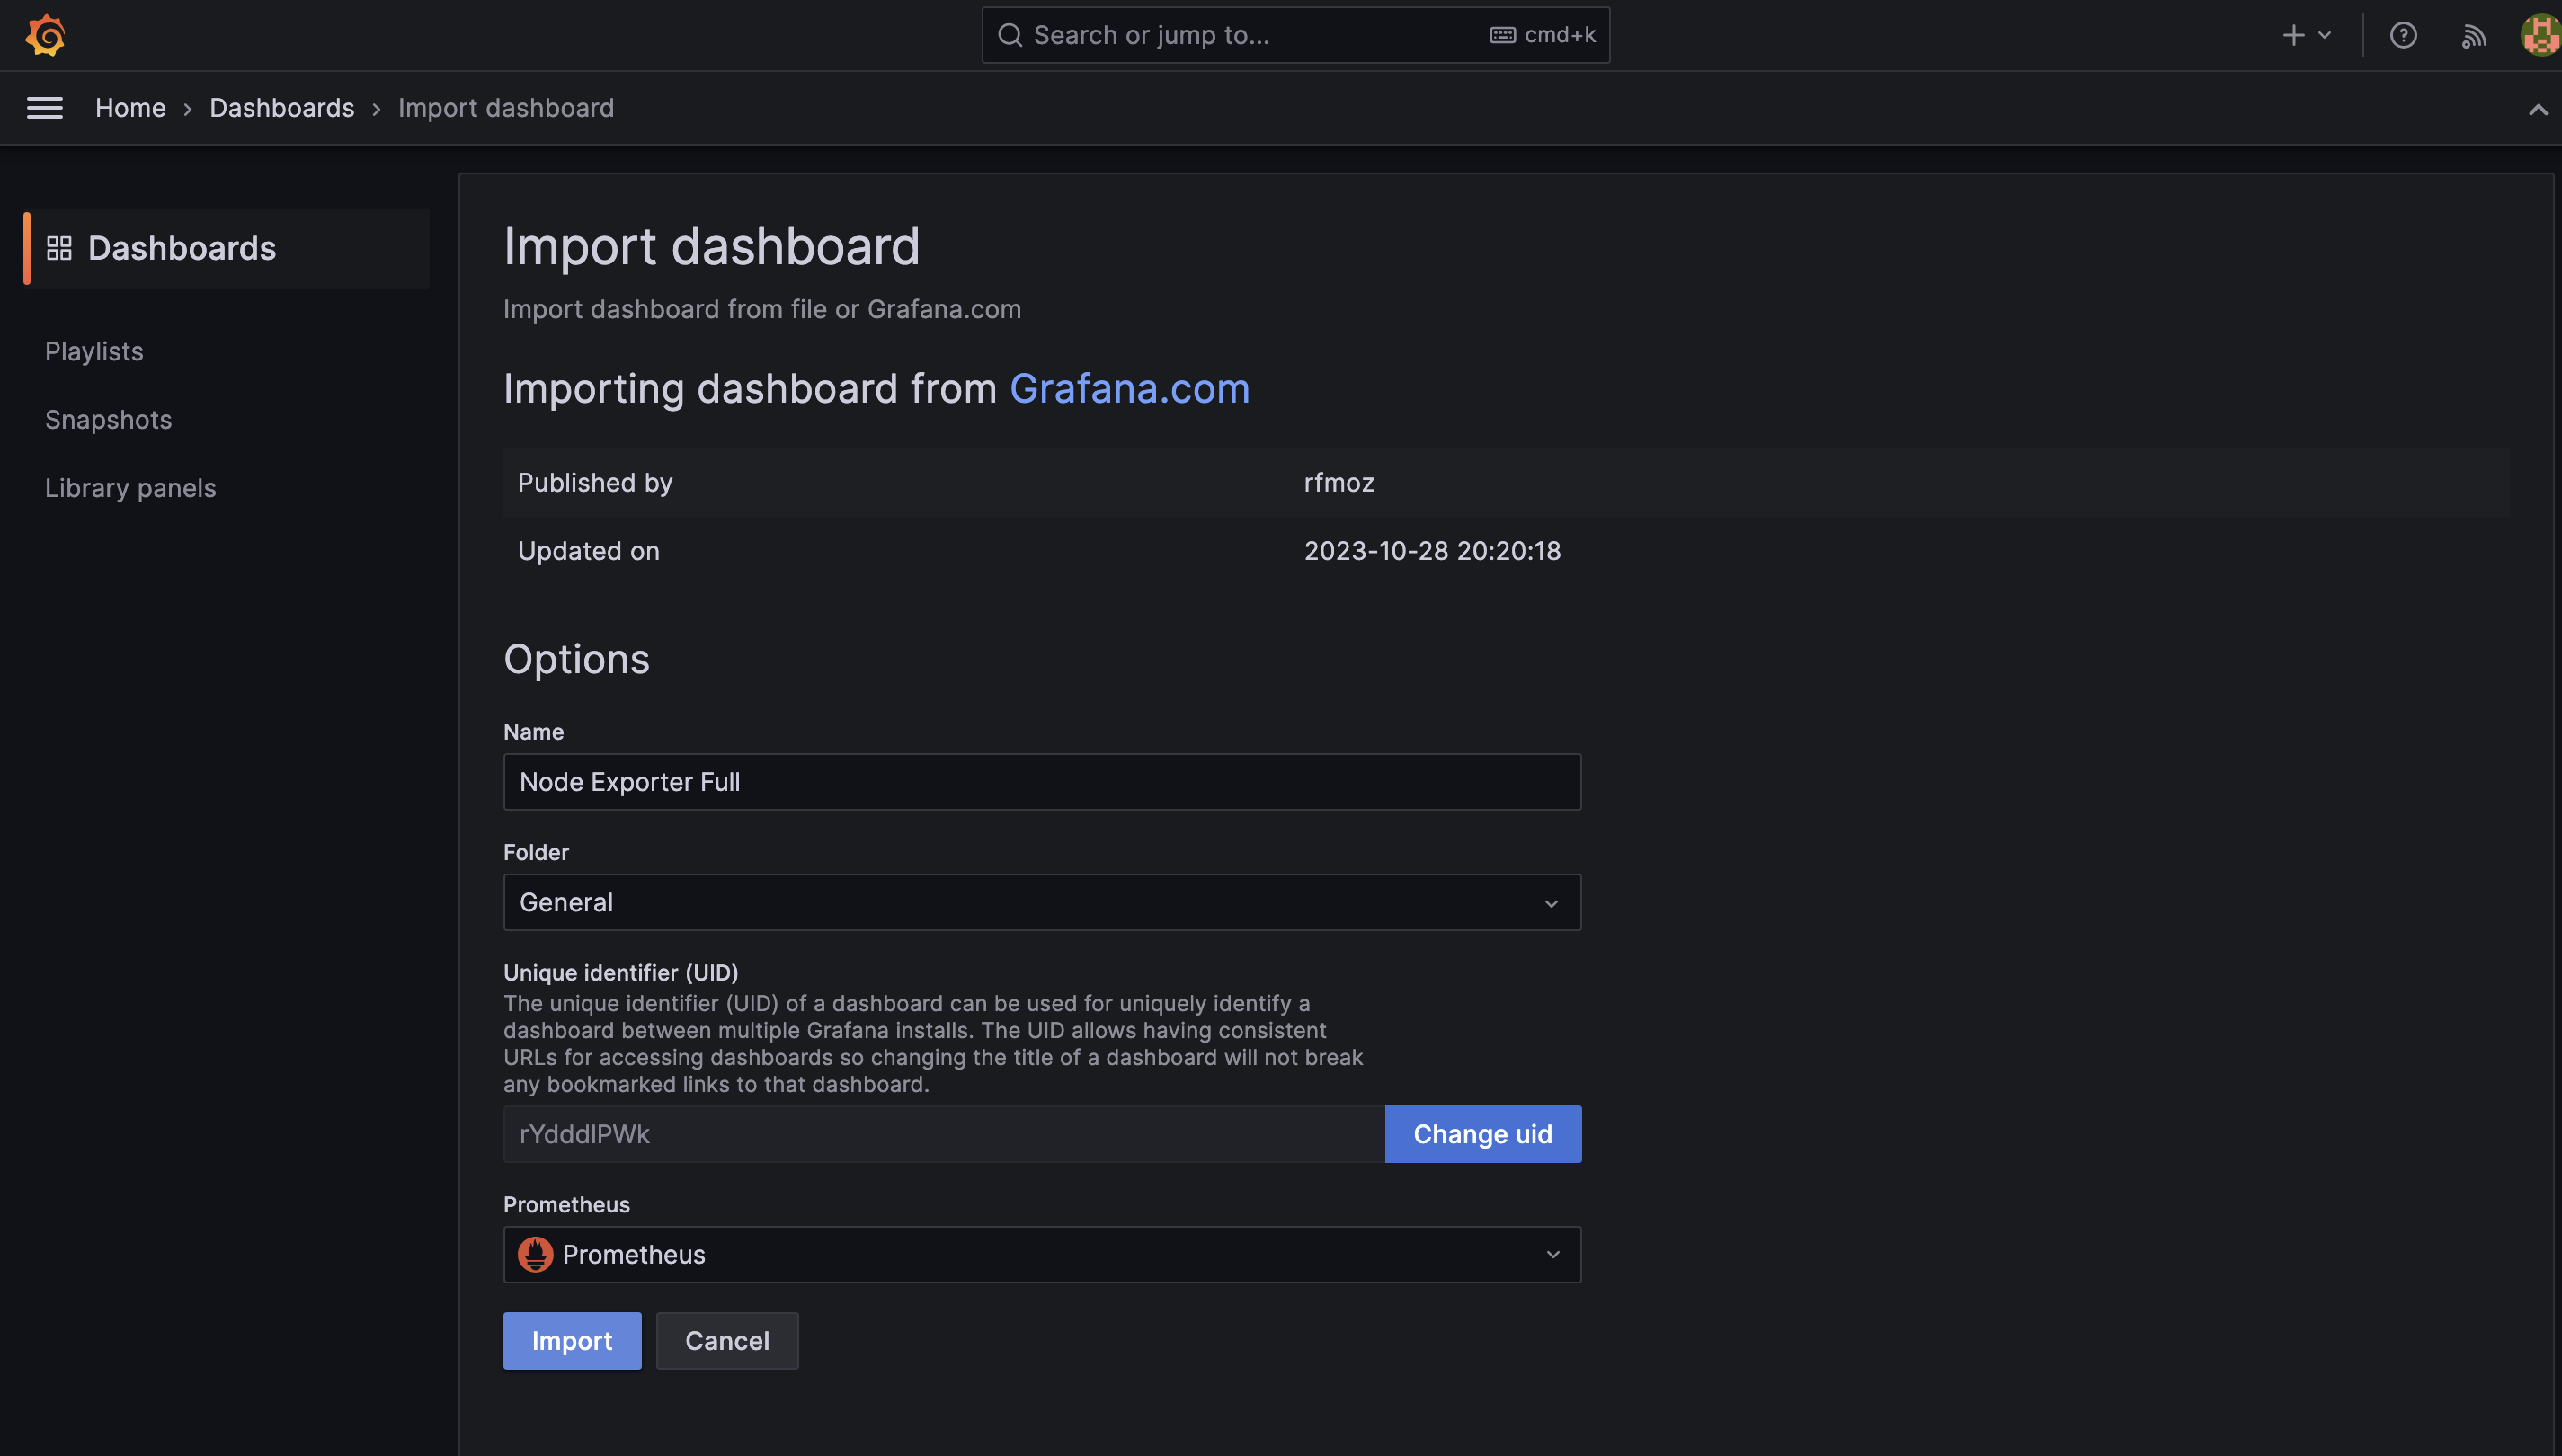
-
Once the import is complete, we’ll be redirected to the new imported dashboard which’ll also be visible under the Dashboards page.
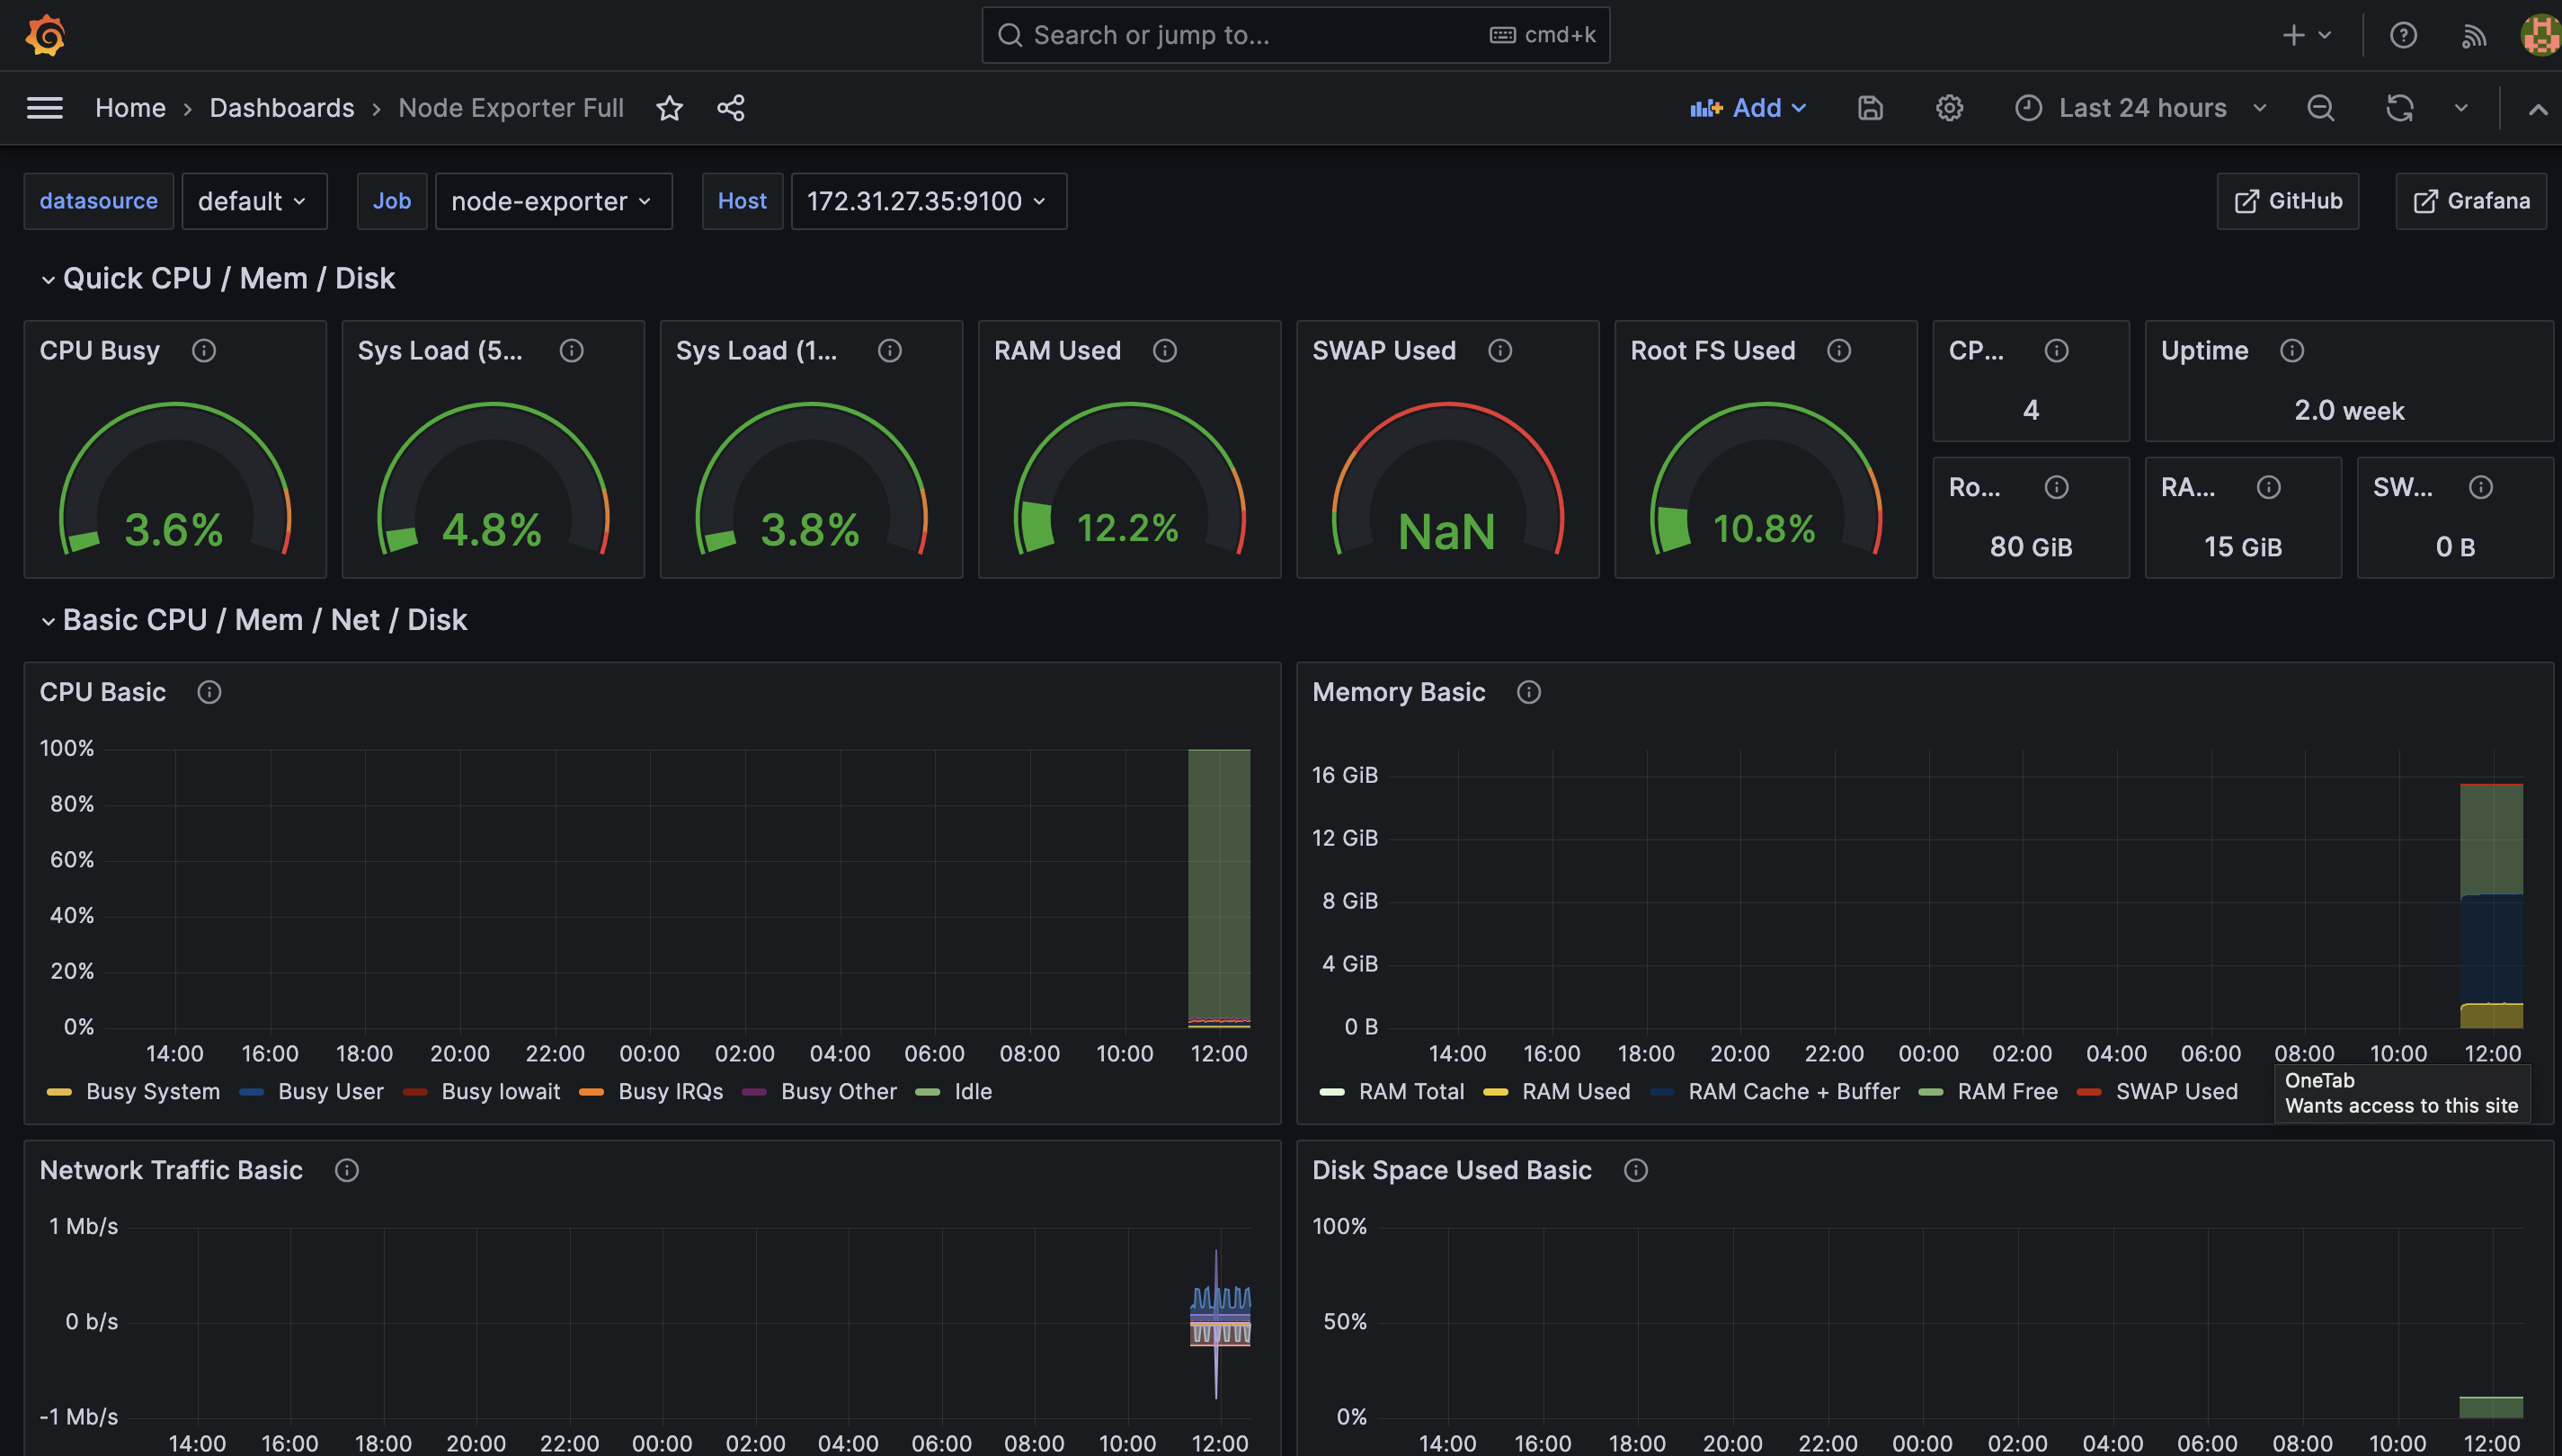
We can use this Node Exporter dashboard to monitor & observe the health of our nodes present in our Kubernetes Cluster.
Conclusion
In this blog, we learned how to integrate Prometheus and Grafana using the helm chart. We also learned how to import dashboards into Grafana from the Grafana library.
In the next blog, we will explore how to integrate Grafana Loki with Grafana and collect and store event-related metrics using the Kubernetes Event Exporter.
Follow @bigbinary on X. Check out our full blog archive.