Profiling your zsh setup with zprof
October 12, 2023
While using frameworks like oh-my-zsh to upgrade your
shell, it is pretty easy to get carried away with all the available plugins.
This can eventually take a toll on your shell’s performance. One significant way
it can affect your workflow is by slowing everything down. The more items you
add to your .zshrc file, the more time your shell will need to start up.
Profiling your shell is a good start to figuring out what is slowing it down.
zprof
zprof is a utility that comes packaged with zsh, which you can use to profile your zsh script.
Add the following to the top of your .zshrc file to load zprof.
zmodload zsh/zprof
At the bottom of your .zshrc, add the following.
zprof
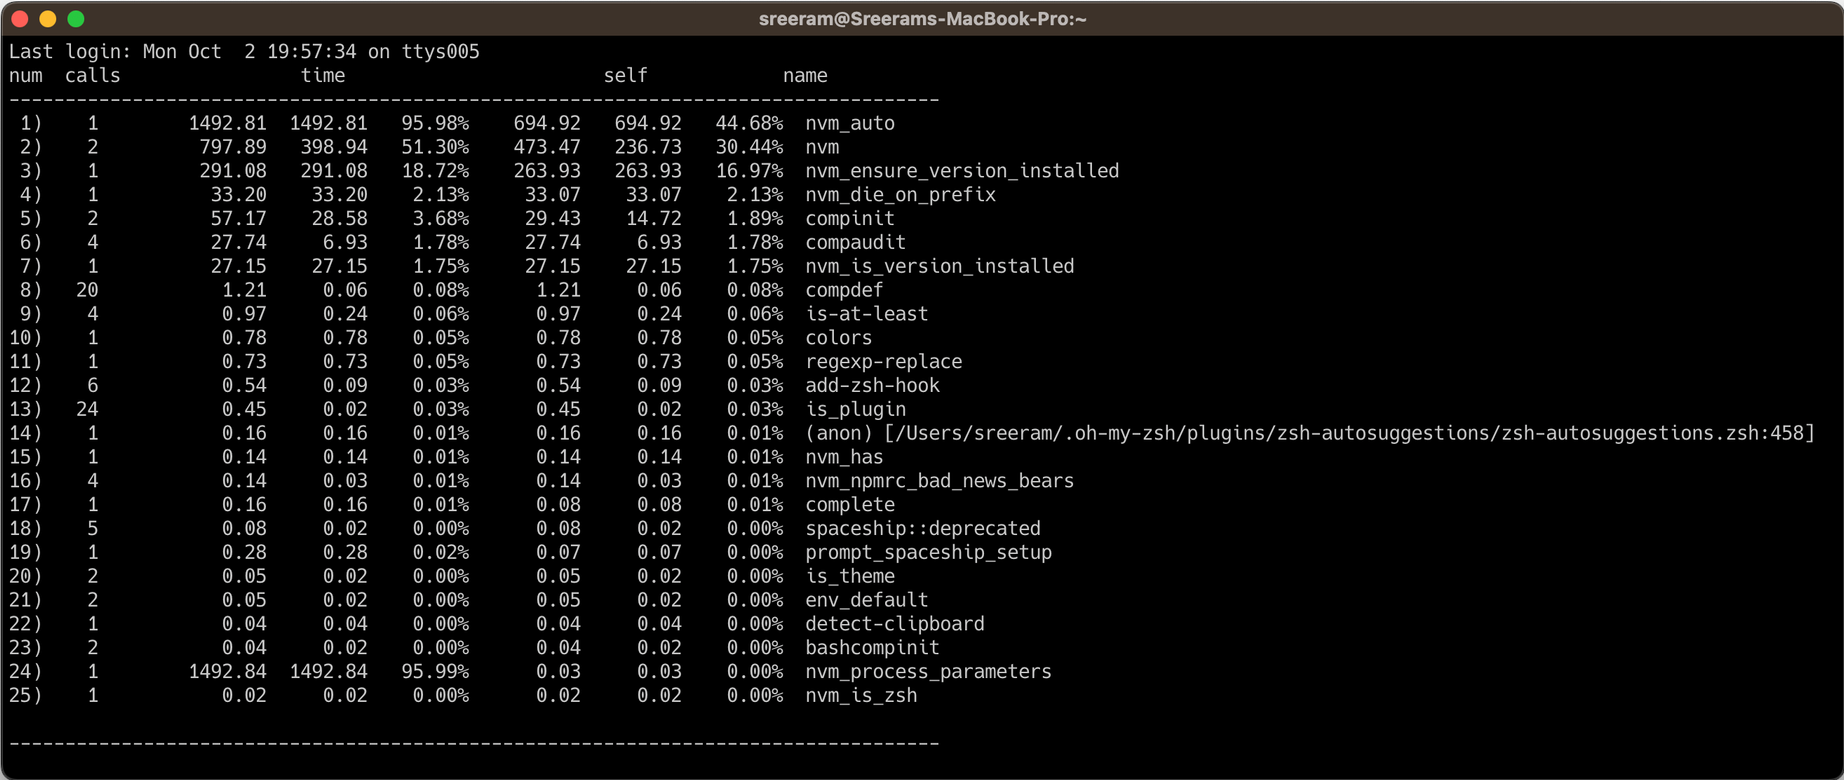
This would profile your zsh script and print a summary of all the commands run
during your shell startup and the time it takes to execute them. Run exec zsh
to apply the changes and restart your shell. Your shell will print something
like this:

With this you can see which commands are taking the most time to load. Enabling profiling has helped pinpoint the issue and now you can look into fixing it. In the above example, you can see that nvm is taking up a considerable amount of time.
Follow @bigbinary on X. Check out our full blog archive.